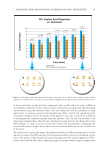
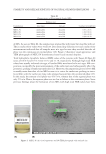
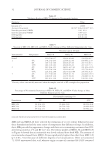
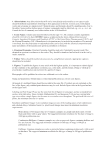
LUXURY CUES FACILITATE THE CONNECTION BETWEEN SOCIAL DOMINANCE AND REWARD 41 Department of Imaging Neuroscience, London, UK http://www.fi l.ion.ucl.ac.uk/spm/ software/spm12). T1-weighted anatomical images were acquired using the following pa- rameters: 150 slices, thickness, 1.0 mm, TE = 2.0 ms, TR = 23 ms, FOV = 240 × 240 mm2, FA = 30°, and matrix size = 240 × 240. EPIs were spatially realigned, co-registered (T1 to EPI), and normalized to the Montreal Neurological Institute template. Normal- ized images were smoothed using an 8-mm full-width half-maximum Gaussian kernel. The data were temporally convolved with hemodynamic response function and high pass fi ltered with a cutoff period of 128 s. We searched th e local maximum points within the nearest 5 mm from the coordinates of the left caudate nucleus (-12 2 23) (1), the right caudate nucleus (10 14 18) (9), the VS (10 4 -2) (10), and the DMPFC (-3 47 49) (11). We then selected spherical regions within a 5-mm radius centered at these points as the ROIs and investigated signifi cant activation at p 0.05 [family-wise error corrected, small volume correction], in the con- trast of the third session (post-Luxury vs. post-Basic) versus the fi rst session (pre-Luxury vs. pre-Basic), and in the contrast of Luxury versus Basic both in the third session (post- Luxury vs. post-Basic) and fi rst session (pre-Luxury vs. pre-Basic). Moreover, we con- ducted a multiple comparison analysis based on the Holm method (p 0.05) (12). Furthermore, we set the DLPFC (33 15 45) (8) as the ROI and conducted a multiple re- gression analysis with the eigenvariate value for the DLPFC as the dependent variable and those of the other ROIs as the independent variables (p 0.05). The multiple regression analysis was conducted for each contrast of the fi rst (pre-Luxury vs. pre-Basic) and third (post-Luxury vs. post-Basic) sessions. Moreover, we analyzed the residuals by performing the Shapiro–Wilk (S-W) test of normality (p 0.05) and calculated the Durbin–Watson (D-W) statistic for the null hypothesis of no autocorrelation. RESULTS INFLUENCE OF THE LUXURY CUE ON BRAIN ACTIVITY In session 1, whe re we compared luxury and basic creams before showing product infor- mation, the ROI analyses did not show signifi cant activation in any region. However, the ROI analyses in session 3 showed signifi cant activation in four regions compared with session 1, which indicates the effect of the product information. These areas were the left caudate nucleus (p = 0.032), the right caudate nucleus (p = 0.006), the VS (p = 0.022), and the DMPFC (p = 0.004) (Table 1 and Figures 2 and 3). Each Euclidean distance was 1.00, 0.00, 0.00, and 3.32 mm, respectively. In addition, the ROI analyses in session 3, where we compared creams of different quality after showing the product information, also revealed signifi cant activation in the right caudate nucleus (p = 0.006) and the DMPFC (p = 0.015) (Table 1 and Figures 2 and 3). REGIONS WHICH SHO WED SIGNIFICANT CORRELATIONS WITH THE DLPFC Activity in the r ight DLPFC was positively correlated with activity in the DMPFC (t = 3.327, p = 0.004) and the VS (t = 2.239, p = 0.037) (adjusted R2 = 0.437 S-W statistic = 0.917, p = 0.066 D-W statistic = 1.826) in the third session (post-Luxury vs. post-Basic), whereas there was no signifi cant correlation in the fi rst session (pre-Luxury vs. pre-Basic) (Figure 4).

JOURNAL OF COSMETIC SCIENCE 42 DISCUSSION In the present st udy, we found signifi cant changes in brain activity with the same tactile stimuli before and after providing participants with the product information. This change could have been dependent on the memory of the visual information that was shown in the second session. The caudate nucleus and the VS were signifi cantly activated after receiving visual information in the Luxury condition compared with the Basic condition. Activation of the caudate nucleus is associated with rewards of touch (1) and social evalu- ation (9). In addition, it is related to the affective aspect and also the discriminative aspect of touch (2). The signifi cant activity in the caudate nucleus was observed only in the post-Luxury versus post-Basic, but not in the pre-Luxury versus pre-Basic. Therefore, in the fi rst session, the difference in the texture alone may not be associated with reward. Only after learning the association between the texture and the value based on the luxury Figure 2. The location of the ROI. The differential activity in the VS, caudate nucleus, and DMPFC was signifi cantly higher in the third session than in the fi rst session. L: left, R: right. Table I Activation of the Brain Regions Brain region First Third Third versus First p Beta p Beta p Beta Left caudate nucleus 0.032 -0.783 ± 0.104 0.560 1.31 ± 0.162 0.116 1.95 ± 0.150 Right caudate nucleus 0.006 -2.13 ± 0.124 0.642 2.90 ± 0.104 0.006 3.66 ± 0.154 VS 0.022 -2.13 ± 0.0908 0.668 0.998 ± 0.118 0.185 2.23 ± 0.139 DMPFC 0.004 -1.17 ± 0.302 0.672 3.17 ± 0.327 0.015 2.98 ± 0.467 First: pre-Luxury versus pre-Basic third: post-Luxury versus post-Basic third versus fi rst: (post-Luxury vs. post-Basic) versus (pre-Luxury vs. pre-Basic).
Purchased for the exclusive use of nofirst nolast (unknown)
From: SCC Media Library & Resource Center (library.scconline.org)