133 ImprovedPROVED AVB PhotostabilityOTOSTABILITY UsingING NLCs
RESULTS AND DISCUSSION
AVB QUANTIFICATION
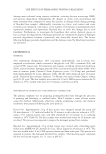
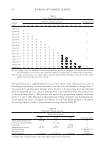
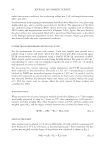
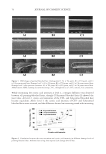
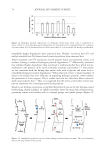
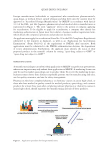
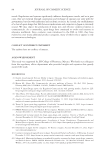
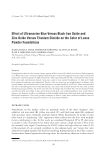
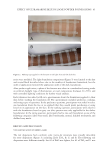
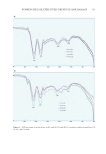
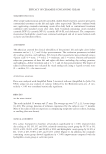
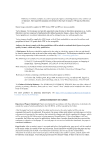
The analytical method was able to elute AVB in 3.5 minutes. The presence of two peaks
was identified (Figure 1), one at 2.2 minutes corresponding to AVB in its keto form, and
the other at 3.4 minutes corresponding to its enol form, as described by Abid et al.24 The
method was linear, with a correlation coefficient r =0.9995, and all points on the curve
presented RPD 5%. Accuracy was in the range of 5% of variation (95–105%). Detection
and quantification limits were 0.0509 and 0.1542 µg/mL, respectively. As for selectivity,
no changes were observed in the peaks obtained from AVB, in relation to the peaks of the
isolated candidate components of the formulations.
AVB SOLUBILITY
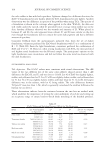
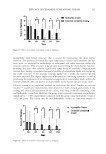
AVB showed different solubilities in the liquid lipids: 49.20 ± 2.83 mg/mL−1 in oleic acid,
126.79 ± 7.87 mg/mL−1 in isopropyl myristate, and 124.85 ± 1.95 mg/mL−1 in capric and
caprylic acid triglycerides. AVB solubility in mineral oil and sesame oil was 17.22 ± 6.50 mg/
mL−1 and 45.45 ± 1.57 mg/mL−1, respectively.
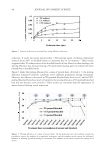
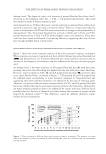
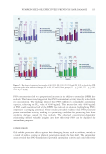
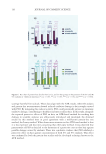
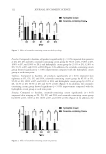
THERMAL ANALYSIS (DTA AND TG/DTG)
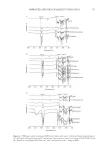
Figure 2 shows the DTA curves of AVB and the mixture of AVB with lipid-based excipients.
The DTA curve of AVB shows a narrow endothermic peak with T
peak at 86.45°C. The
greatest variations in AVB T
peak (29.67–20.69°C) were observed in the binary mixtures
with Poloxamer 188, glyceryl monostearate, and beeswax. Anticipations of the AVB
Figure 1. Chromatogram of AVB sample obtained by HPLC. Zorbax Eclipse (Agilent) XDB – C18 column
150mm × 4.6 mm, 3.5 µm, with precolumn C18 12.5 × 4.6 mm, 3.5 µm (Agilent), maintained at 30°C. The
mobile phase was composed of ACN and water 90:10, v/v, at a 1 mL/min-1 flow. The injection volume was
10 µL. Sample concentration was 30 µg/mL.1
RESULTS AND DISCUSSION
AVB QUANTIFICATION
The analytical method was able to elute AVB in 3.5 minutes. The presence of two peaks
was identified (Figure 1), one at 2.2 minutes corresponding to AVB in its keto form, and
the other at 3.4 minutes corresponding to its enol form, as described by Abid et al.24 The
method was linear, with a correlation coefficient r =0.9995, and all points on the curve
presented RPD 5%. Accuracy was in the range of 5% of variation (95–105%). Detection
and quantification limits were 0.0509 and 0.1542 µg/mL, respectively. As for selectivity,
no changes were observed in the peaks obtained from AVB, in relation to the peaks of the
isolated candidate components of the formulations.
AVB SOLUBILITY
AVB showed different solubilities in the liquid lipids: 49.20 ± 2.83 mg/mL−1 in oleic acid,
126.79 ± 7.87 mg/mL−1 in isopropyl myristate, and 124.85 ± 1.95 mg/mL−1 in capric and
caprylic acid triglycerides. AVB solubility in mineral oil and sesame oil was 17.22 ± 6.50 mg/
mL−1 and 45.45 ± 1.57 mg/mL−1, respectively.
THERMAL ANALYSIS (DTA AND TG/DTG)
Figure 2 shows the DTA curves of AVB and the mixture of AVB with lipid-based excipients.
The DTA curve of AVB shows a narrow endothermic peak with T
peak at 86.45°C. The
greatest variations in AVB T
peak (29.67–20.69°C) were observed in the binary mixtures
with Poloxamer 188, glyceryl monostearate, and beeswax. Anticipations of the AVB
Figure 1. Chromatogram of AVB sample obtained by HPLC. Zorbax Eclipse (Agilent) XDB – C18 column
150mm × 4.6 mm, 3.5 µm, with precolumn C18 12.5 × 4.6 mm, 3.5 µm (Agilent), maintained at 30°C. The
mobile phase was composed of ACN and water 90:10, v/v, at a 1 mL/min-1 flow. The injection volume was
10 µL. Sample concentration was 30 µg/mL.1