139 ImprovedPROVED AVB PhotostabilityOTOSTABILITY UsingING NLCs
CHARACTERIZATION OF THE NLCS
TURBISCAN
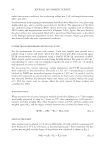
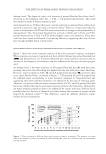
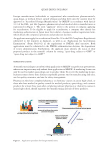
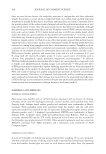
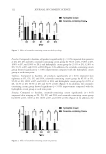
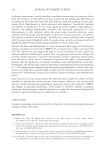
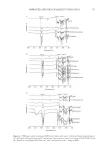
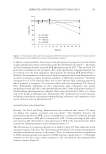
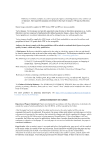
F3 formulation was analyzed by dynamic turbidimetry for assessment of its physical
stability. In the graph results (Figure 5), the x-axis represents a residual percentage of
backscattering light, and the y-axis represents the height of the tube containing the
sample. This graph allows the comparative verification of the variation profiles of the
backscattered light at different times and sample heights if the profiles overlap at different
times, the product can be considered stable. The occurrence of destabilization phenomena
(aggregation and flocculation) and phase separation modify the interaction of the light
beam with the formulation dispersant, causing an increase or decrease in the intensity of
transmission and backscattering due to the variation in the size of the particles. For F3, a
variation of backscattering of ± 1% was observed, demonstrating the physical stability
of the formulation.29
FORMULATION PHYSICOCHEMICAL STABILITY
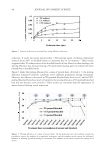
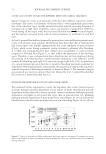
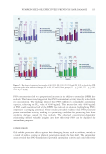
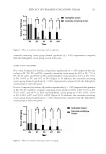
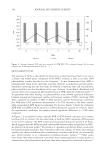
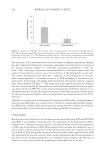
The results of MD and PdI of the formulation were monitored for 30 days to corroborate the
results of physical stability obtained through the backscattering analysis. No aggregation,
flocculation, or phase separation were observed. As shown in Figure 6, no significant changes
in the average particle size and PdI were measured (p 0.05). A statistically significant
difference was, however, observed in the NLCs zeta potential on day 30 (p 0, 05). This
change is believed not to influence the steric stability of the particles in the formulation,
since zeta values larger than 20 mV tend to be sufficient to maintain long-term stability
(as demonstrated by Medeiros et al.30) after the preparation of NLCs encapsulating an UV
filter, prepared using carnauba wax, and capric/caprylic acid triglycerides.
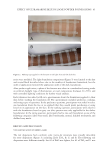
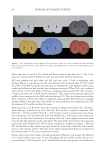
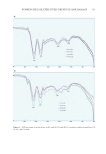
Figure 5. Variation of backscattering profile of the F3 formulation, obtained by scanning the NLC sample
every 1h, for 24h, at 37°C, using Turbiscan Lab.
CHARACTERIZATION OF THE NLCS
TURBISCAN
F3 formulation was analyzed by dynamic turbidimetry for assessment of its physical
stability. In the graph results (Figure 5), the x-axis represents a residual percentage of
backscattering light, and the y-axis represents the height of the tube containing the
sample. This graph allows the comparative verification of the variation profiles of the
backscattered light at different times and sample heights if the profiles overlap at different
times, the product can be considered stable. The occurrence of destabilization phenomena
(aggregation and flocculation) and phase separation modify the interaction of the light
beam with the formulation dispersant, causing an increase or decrease in the intensity of
transmission and backscattering due to the variation in the size of the particles. For F3, a
variation of backscattering of ± 1% was observed, demonstrating the physical stability
of the formulation.29
FORMULATION PHYSICOCHEMICAL STABILITY
The results of MD and PdI of the formulation were monitored for 30 days to corroborate the
results of physical stability obtained through the backscattering analysis. No aggregation,
flocculation, or phase separation were observed. As shown in Figure 6, no significant changes
in the average particle size and PdI were measured (p 0.05). A statistically significant
difference was, however, observed in the NLCs zeta potential on day 30 (p 0, 05). This
change is believed not to influence the steric stability of the particles in the formulation,
since zeta values larger than 20 mV tend to be sufficient to maintain long-term stability
(as demonstrated by Medeiros et al.30) after the preparation of NLCs encapsulating an UV
filter, prepared using carnauba wax, and capric/caprylic acid triglycerides.
Figure 5. Variation of backscattering profile of the F3 formulation, obtained by scanning the NLC sample
every 1h, for 24h, at 37°C, using Turbiscan Lab.