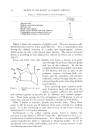
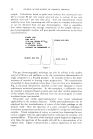
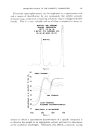
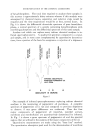
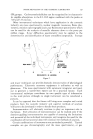
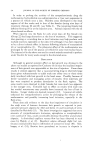
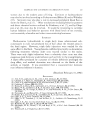
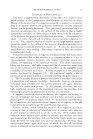
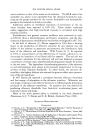
328 JOURNAL OF THE SOCIETY OF COSMETIC CHEMISTS is 5.8 microns for menthyl acetate, 8.05 microns for menthol, 10.9 microns and menthofuran is determined at 13.6 microns. Alkanolamides which are fatty acid amides derived from monoethanol- amine, diethanolamine or monoisopropanolamine are used to enhance foaming characteristics or as emulsification agents. It is frequently necessary to distinguish among these types in product isolates or in the product itself. Figure 6 which shows the infrared spectra of these three amides demonstrates that this technique is ideally suited for this work. It is observed that all three compounds exhibit hydroxyl absorption in the 2.9-3.1 micron region, amide and methylene chain absorption at 6.1-6.2 and 13.9 microns, respectively, and INFRARED SPECTRA OF ALKANOLAMIDES L-M DIETHANOLAMIOE L-M ISOPROPANOLAMIDE COCO MONOETHANOLAMIDE WAVELENGTH IN MICRONS Figure 6. a trace of ester at 5.7-5.8 mi- crons. The monoethanolamide and the diethanolamide have ab- sorption peaks in the 9.2-9.6 mi- cron region which is characteristic of primary alcohols whereas the isopropanolamide shows secondary alcohol absorption at 8.7-9.0 microns. Therefore, at this point, the primary alcohol amides can be differentiated from secondary alcohol amides. The mono- and diethanolamide can be distin- guished from one another at 6.4 and 3.25 microns which are char- acteristic of the carbonyl and N-H vibration regions, respectively. The application of the infrared technique as a means of identification of isolated components in cosmetic products is invaluable. There are occasions where it is necessary to control or distinguish the type of gum that is being used in a product. The spcctra in Fig. 7 demonstrate the specificity of infrared spectrometry. Here are seen the spectra of three widely used gums carboxymethylcellulose, Veegum and Irish moss. Examination of these three spectra will show that if one of these gums is isolated from a product, its identification can easily be made bv merely comparing its infrared spectrum to the three standard curves. Irish moss exhibits characteristic peaks at 8.08, 10.77 and 11.85 microns which distinguish it from the other two gums. Veegum is an inorganic substance which is composed primarily of SiO2. The infrared spectrum of Veegum exhibits a broad absorption band at 9.25 to 10.25 microns which is characteristic of SiO2. Veegum, being inorganic, shows no absorption in the 3.3-3.5 micron region which would denote the presence of CH2 and

INSTRUMENTATION IN THE COSMETIC LABORATORY 329 CHa groups. Carboxymethylcellulose can be recognized by its characteris- tic steplike absorptions in the 8.5-10.2 region combined with the peaks at 7.05 and 7.55 microns. Other instrumental techniques which have application in the cosmetic industry are mass spectrometry, nuclear magnetic resonance, flame pho- tomerry, emission spectrography and x-ray fluorescence spectrometry which can be used for the analysis of metallic elements down to the parts per million range. X-ray diffraction spectrometry may be applied to the determination and identification of many crystalline compounds. Isotope - \ fl IR• MOSS• • [ • ', ,/ J INFRARED • [/ • •, / / ABSORPTIONS 7 8 9 I0 II WAVELENGTH IN MICRONS Figure 7. and tracer techniques can provide dramatic demonstration of physiological performance. Electronic accessory equipment is utilitarian as well as glamorous. The mass spectrometer with automatic integrator and read- out to generate a typewritten report can be a practical luxury. Each instrumental technique contributes its own specific type of information to the total picture although no single instrument can be considered a panacea. It can be expected that the future will bring more complex and varied products from the cosmetic industry and superior methods of analysis will have to be developed in order to handle these products. Instrumentation will obviously continue to play an important role in the future. Full utilization of instrumentation can be realized only if the chemists guiding instrumentation are capable of assessing the limitations and potential of the individual instruments and recognize the need for the coordination of instrumental data with classical wet methods of analysis. Certain combinations of instruments are particularly powerful. Typical examples are gas chromatography and the mass spectrometer, or gas
Purchased for the exclusive use of nofirst nolast (unknown)
From: SCC Media Library & Resource Center (library.scconline.org)