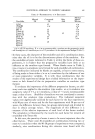
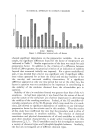
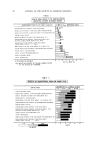
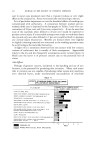
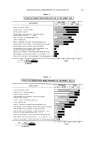
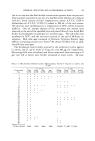
442 JOURNAL OF THE SOCIETY OF COSMETIC CHEMISTS 90-50 groups. The distributions of average differ- ences are shown in Tables 4 and $ for each factor. Inspection of the frequency of differences reveals the overwhelming importance of quantity of water compared to the other factors. This is evident in both the 90-30 and the 90-50 comparisons. In the cases of surfactant concentration, surfactant location, temperature and methods of agitation the values of the differences are small (0.to 1.00) in relation to the differences found in the case of proportion of water (1.00 to 2.00). It is concluded that these preparative variables are of little importance in determining emulsion type. In the case of addition order, a partial concentration of differences at a value of 1.00 is suggestive tha•t this fact6r has some importance in determining emulsion type. The con- clusion that larger quantities of water and adding oil to water leads to o/w emulsions while the reverse leads to w/o emulsions is consistent with emulsion technology practices. A confirmation of this conclusion is obtained by noting the common factors in the methods which yielded only one w/o emulsion from the set of experi- ments with several emulsifier-oil combinations (Table 3). To form an emulsion of the opposite type from that which is predominately determined by the nature of the emulsifier and oil indicates considerable impor- tance for one or more factors in the singular prepara- tion methods. Method 6 appears in this category seven times, method 3 appears twice and method 4 once. The only common factor in these three methods (Table 1) favoring w/o emulsions is the use of 30 per cent water. No other factors are common to all three of these preparation methods. In methods 6 and 4, water is added to oil. Emulsion Stability In the analysis of the stability results, a procedure similar to that employed to evaluate the influence of the six preparative variables on emulsion type was used. Thus the stability values for a given emulsifier-oil pair for the 90, 50 and 30 per cent experiments were summed, and averaged differences were calculated for the 90-30 and 90-50 groups. Combination of stability results for '1 q- I+

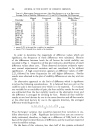
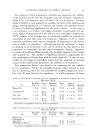
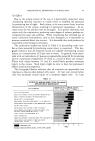
STATISTICAL APPROACH TO COMMON VARIABLES TABLE 4--EMULSION TYPE 90-30 (30 CASES) Frequency of Differences 443 Average Difference between Levels (effects) Emulsifier H•O, Emulsifier Temp., Order of Conc. % Location øC. Addition Agitation 0 0.25 0.50 0.75 1.00 1.25 1.50 1.75 2.00 7 8 3 5 5 5 6 7 6 4 13 10 11 7 13 5 5 4 5 7 7 1 5 7 1 8 12 2 1 TABLE 5--EMULSION TYPE 90-50 (9 CASES) Frequency of Differences Average Difference between Levels Emulsifier H.20, Emulsifier Temp., Order of (effects) Conc. % Location øC. Addition Agitation 0 3 3 1 1 4 0.25 1 1 1 2 0.50 4 4 4 2 2 0.75 1 1 1 1 1.00 5 2 5 1 1.25 2 1,50 2 both o/w and w/o emulsions, however, would be inappropriate. To circumvent this difficulty, the following procedure was used. In the analysis of the factors leading to stable o/w emulsions, the stabilities of the w/o emulsions were designated as zero, regardless of their observed value. Nonmeasurable emulsion types were treated in the same way. In the analysis of w/o emulsions, a value of zero similarly was assigned to the stability of the o/w emulsions formed with the same emulsifier-oil pair. Computations of the differences between the values of the two levels for each of the six factors i.nvestigated were carried out by means of an 'IBM 650 computer. As an example of the differences found between the •two levels, the results pertaining to stability of o/w emulsions after one Iday, for the factor of emulsion concentration, are shown in Table 6. IThe sign of the difference values indicates which level of the factor under study may have significance. Thus a positive value means that a 2.5 per •cent level of emulsifier favors the formation of a stable o/w emulsion, •whereas a negative value indicates that 1 per cent emulsifier favors a stable o/w emulsion.
Purchased for the exclusive use of nofirst nolast (unknown)
From: SCC Media Library & Resource Center (library.scconline.org)