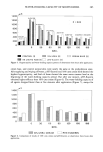
WATER-HOLDING CAPACITY OF MOISTURIZERS 283 cation, showing high hygroscopicity. Most of this increase was lost within 30 seconds, followed by a gradual return to a prehydration level in 180 seconds (Figure 3). WATER CONTENT OF THE SKIN SURFACE AFTER APPLICATION OF MOISTURIZERS From statistical analysis, we found that the distribution pattern of the data was not in a normal distribution. Therefore, the analysis system that we used to analyze the data is a non-parametric test (Kruskal-Wallis test) to show the differences between the groups. From the Kruskal-Wallis test it was shown that the differences between the groups had a statistical significance of P 0.00001. Although the Kruskal-Wallis test can test the hypothesis that there is at least one group that differs from the others, it is unable to determine which specific group has a real difference in relation to another. Therefore, the least significant difference (LSD) analysis can be useful to determine comparatively how different each group is from another, or, in other words, we can rank the groups according to the value of interest by comparing the value of one group to that of another pair, by pairs, until every pair is analyzed. We then used a numeric number to replace the testing agents: 1 = normal skin as a control 2 = 10% urea cream 3 = cream base 4 = 5% lactic acid cream 5 = pH5-Eucerin Five minutes after the application of agents we used the least significant difference (LSD) ...w.s 1000 800 600 400 200 0 30 60 90 120 150 180 sec. i RIGHT FOREARM • LEFT FOREARM Figure 3. Hygroscopicity and water-holding capacity pattern of pretreated normal skin, right and left forearm.

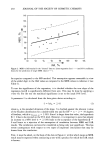
284 JOURNAL OF THE SOCIETY OF COSMETIC CHEMISTS analysis in order to rank and compare the results between the group at level P = 0.05 (Figure 4). Three hours after the application of agents we also used the least significant difference (LSD) analysis in the same manner at level P = 0.05 (Figure 5). We found that conductance of the prehydration state of normal skin is about 180 ItS. After hydrating, normal skin showed high conductance around 800 ItS, but it declined rapidly within 30 seconds and returned to the prehydratic level in 180 seconds. This result implies that the normal skin surface has an ability to absorb water but cannot retain it for long, or that it has a low water-holding capacity (Figure 3). Observation at five minutes after application of the agents (Figure 4) showed that the baseline water content of all agents was better than with control normal skin. PH5- Eucerin and 10% urea cream had the highest level of water content among the agents, followed by 5% lactic acid cream and cream base. After applying drops of water on the testing areas and wiping them off in ten seconds, pH5-Eucerin obtained the highest hygroscopicity, followed by 10% urea cream, 5% lactic acid cream, and cream base that had the same level of hygroscopicity. The water-holding capacity of all agents declined in a slower manner than with control normal skin, and at 180 seconds the water content of 10% urea cream, pH5-Eucerin, and 5% lactic acid cream was more than the cream base and control normal skin levels. The water-holding capacity of 10% urea cream, 5% lactic acid cream, and cream base declined in a slower manner than in PH5-Eucerin, and 10% urea cream was the slowest. From observation three hours after application (Figure 5), we found that at the prehy- dration state, pH5-Eucerin had the highest water content among all agents and that every agent had a lower water content when compared to the same agent five minutes after application. The water content levels of 5% lactic acid cream, 10% urea cream, 1400 1200 - f P = 0,05 1000 800 - 4,5)a)z 400 200 0 0 30 60 90 120 150 180 sec. • CONTROL [11 • 10% UREA [21 • CREAM BASE [31 • 5% LACTIC ACID [4]• pH5-Eucerin [5] Figure 4. Hygroscopicity and water-holding capacity pattern of observation five minutes after application.
Purchased for the exclusive use of nofirst nolast (unknown)
From: SCC Media Library & Resource Center (library.scconline.org)