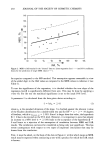
SKIN ROUGHNESS ASSESSMENT 295 Table IV Number of Products in Four Different Classes, Characterized by Their Means and Their Widths (given in brackets) for MB and IA Testing of 22 Skin Care Products MB test (16) IA test (4) Descriptor Mean Number of cases Mean Number of cases Class 1 + + 68 0 92 5 Class 2 + 84 8 96 12 Class 3 o 100 9 100 1 Class 4 - 116 4 104 3 roughness. Table IV summarizes for the test procedures the positions of the classes and the number of products found therein. The ratings for the individual products according to MB and IA testing and based on this scheme are given in Table I. DISCUSSION The results of Figure 1 show that there is initially no correlation between MBR and IAR values. Only a reduced data set without the outlier (IAR -- 57.09) leads to a correlation that is just significant on the 95% confidence level (see Figure 2). Such a correlation would be of practical value if it could be applied for calibration purposes, namely for the accurate prediction of an unknown MBR value of a product from its IAR value or vice versa. The 95% confidence range for the predicted MBR values in Figure 2 indicates that already the first task is rather difficult. As Table II shows for four cases, chosen to cover the observed range of IAR values, the predicted MBR values are already between 4 and 10 units off the mark. The situation worsens when the minima and maxima of the possible range for the MBR values are considered. In all cases and regardless of the IAR value, the possible minimum value is within the range of the well-performing and the maximum value in the range of the badly performing products. Even for the product performing best in image analysis (No. 3, IAR = 90.94, + + ), its MBR value can be expected to be somewhere between MBRmi n = 65 (better than + +) or MBRma,, = 112 ( - ). The worst performing product in image analysis (No. 15, IAR = 102.54, - ) might actually do quite well in MBR testing (MBRmi n = 84.5, q- ), but it might also come out as totally unacceptable (MBRma,, = 132, worse than -). The comparison between Figures 2 and 3 shows that the situation even worsens if the correlation is applied as a calibration to predict IAR values from values obtained via the MB method, which is more practical to apply. The results summarized in Figure 3 are detailed for five cases in Table III, showing that the predicted IAR values are between 1 and 15 units off the mark. The 95% range for the IAR-predictions shows that in all cases unrealistic values are obtained, either for the minimum or the maximum, so that no power can be conceded to MB testing to predict IAR values. Taking the image analysis as the objective test method and providing the independent

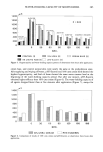
296 JOURNAL OF THE SOCIETY OF COSMETIC CHEMISTS variable in the correlation, this would, furthermore, seem to imply that MB testing has no discriminating power with respect to testing skin roughness. This consequence does not fit the general empirical experience with the test (5), and it has, hence, to be concluded that both methods are subject to substantial and possibly similar measure- ment errors that will make the validity of the discrimination of small effects, and hence of small product differences, questionable. This point is supported by the existence of the outlier for IA testing. Though we accepted the point as an outlier to conduct the statistical analysis of the data, this decision is in reality rather difficult to justify. The outlier does not relate to a single data point, which might be omitted on the basis of the assumption of a single measurement error, but it actually is the mean roughness value measured for the product applied by 20 test persons. This leads to the conclusion that image analysis is either prone to substantial, random, experimental errors or that in this case a systematic measurement bias passed undetected for a whole series of tests. In any case, the outlier is difficult to understand and its existence certainly gives weight to the assumption that IA testing is subject to experimental errors comparable to those of the methylene blue method. Comparing the test results for the two methods on a semantic basis, the results in Table IV show that image analysis comes to substantially better ratings in the classification scheme than the methylene blue test. A total of 17 products is rated as good or very good by IA, while no product is classed as very good by MB and only 8 as good. In contrast to image analysis, MBR testing indicates that skin roughness is largely unchanged or only slightly improved after cosmetic product use. While the overall ratings are already substantially different for the two test methods, the individual classifications show a high degree of inconsistency. Only in six cases do both tests come to equal ratings in 11 cases ratings are obtained that are one class apart. In four cases ratings are even dissimilar to the extent of two classes, so that, for example, products 10 and 11 are rated very good (+ + ) by IA and only acceptable by MB, and products 21 and 22 are rated good by IA and unacceptable by the MB test (see Table I). In view of the similar quality of the correlations found by Schrader et al. (2) for the scanning method vs IA (r = 0.315) and for skin moisture evaluation vs IA (r = - 0.59), similar arguments and conclusions as for MB vs IA (r = 0.484) can plausibly be expected to apply to these methods. However, a complete evaluation of the data in reference 2 is outside the scope of the present article. CONCLUSION Both methods for the assessment of skin roughness, namely the methylene blue and the image analysis tests, obviously exhibit substantial variability in their results, which even with a rather rough classification system lead to inconsistent test results for the 22 skin care products investigated. This, in turn, leaves some serious questions, if not doubts, with respect to the validity, reproducibility, and accuracy of the tests and, hence, with respect to the requirements set out by Stiftung Warentest (3) for such tests, namely that (in translation), "Modern methods of investigation help us to unequivocally and objectively prove effects and
Purchased for the exclusive use of nofirst nolast (unknown)
From: SCC Media Library & Resource Center (library.scconline.org)