SKIN ROUGHNESS ASSESSMENT 293 Predicting an MBR value, 9i, for a given IAR value, xi, the range within which the MBR result can be expected with 95% probability is given by Zar (4): •i -•- t95%(2),19 Sp, (2) where s[ ] = 2 1 + 1/n + (xi •)2 (3) Syi y'x -- (Xj -- •)2 j=l S2y.x is the residual mean square from analysis of variance, where Sy.x is known as the standard error of regression. n is the total number of IAR data with the individual values x i and the mean i. On the basis of equations 2 and 3, the so-called "confidence bands for single observa- tions" are calculated for the whole range of IAR values. They are given as broken lines in Figure 2. For further discussion, the values for selected products, representing the data range, are summarized in Table II. Accepting for the current argument IA as an objective reference method and the MB method as an indirect but fast and practical method, this will lead to the question within which range (95% confidence limits) the true IAR value can be expected if the MBR value for a product is known from experiments. This question involves a method known as "inverse prediction" (4). Based on the correlation of the IAR and MBR results, the expected IAR value i• can be predicted from an MBR value Yi by i• = (y• - a)/b (4) The related prediction range is given by: • + b(yi- •)/K + t/K (xj - i)2 + K(1 + l/n)] j=l where (5) K = b 2 - t2s2 b (6) and t = t95%(2) ,19 = 2.093. Table II IAR and MBR Values for Selected Cases and the Minimum Values for the 95% Confidence Limits of the Prediction of Single MBR From IAR Values (all values in %) 95% Confidence range for MBR prediction IAR value MBR value MBR value Product no. measured measured predicted min max 3 90.94 84.8 88.5 65.1 112.0 21 94.45 114.5 94.5 72.3 116.7 18 98.65 109.3 101.7 79.4 123.9 15 102.54 104.4 108.3 84.5 132.0

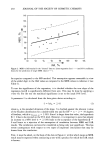
294 JOURNAL OF THE SOCIETY OF COSMETIC CHEMISTS 200 160 ,2ø t o 70 / / / / / / / / / / / / / / / ' ' 160 • ' 80 90 110 120 130 MBR, % Figure 3. IA vs MB test results (analogous to Figure 2) and 95% confidence limits for the inverse prediction of single IAR values from MBR data (---). Solid line gives the IAR value predicted on the basis of the MBR = f(IAR) correlation given in equation 4. The 95% confidence bands for the inverse prediction are shown in Figure 3. The solid line gives the predicted •i (z IAR) values. The values for selected products to represent the data range are given in Table III. To compare the results for the IA and MB tests on a semantic basis, adapted from that applied for consumer-related testing (3), the results for each of the two tests are grouped into four classes, namely very good (class 1, + + ), good (class 2, + ), acceptable (class 3, o), and unacceptable (class 4, -). The class widths were chosen to comprise the range of the cleaned data set in Figure 2, where the position of the classing scheme was set such that the center of class 3 (acceptable, o) was 100%, i.e., the value for unchanged skin Table III MBR and IAR Values for Selected Cases and the Minimum and Maximum Values for the 95% Confidence Range of the Prediction of IAR Values From MBR Results (all values in %) MBR value IAR value R value Product no. measured measured predicted min 95% Confidence range for IAR prediction max 1 78.7 94.86 85.1 - 7.7 109.8 7 90.0 94.70 91.8 39.7 115.9 13 100.6 95.97 98.0 69.8 136.0 19 110.3 102.55 103.7 80.5 171.3 22 122.7 95.91 111.0 83.9 226.7
Purchased for the exclusive use of nofirst nolast (unknown)
From: SCC Media Library & Resource Center (library.scconline.org)