J. Soc. Cosmet. Chem., 44, 289-297 (September/October 1993) The methylene blue and image analysis tests for determining skin roughness: A critical assessment based on data in the literature F.-J. WORTMANN and G. WORTMANN, Deutsches Wollforschungsinstitut, Veltmanplatz 8, D-51 Aachen, Germany. Received November 9, 1992. Synopsis The correlation of data published by Schrader et al. (2) for skin roughness measurements using the methylene blue and image analysis methods is investigated. The results show that the correlation between the methods is poor and unsatisfactory for prediction and calibration purposes. A classification of the data into four classes shows a pronounced inconsistency between results of the two methods. This in turn leads to serious questions, if not doubts, with respect to the validity, reproducibility, and accuracy of the tests when specifying the performance of skin care products. INTRODUCTION On page 980 of his well-known book, Schrader (1) points out (in translation) that Scientific procedures for the evaluation of cosmetic products are continuously gaining importance. To fulfill the high quality standards, demanded nowadays by the market, optimization of products just for optical appearance and for processing performance is insufficient. Testing procedures of practical relevance are required to quantify reproducibly the positive and negative effects of cosmetic products. For skin care products an important effect is related to the reduction of skin roughness. For a recent paper, Schrader and Bielfeldt (2) conducted comparative studies of skin roughness measurements, using image analysis and several in vivo skin testing methods, including the methylene blue adsorption test. According to Schrader (1), the methylene blue test is a simple method for the evaluation of skin roughness. The rougher the skin, the larger its surface and the more intensive the absorption of methylene blue. The methylene blue method has been widely used for industrial quality improvement and control purposes, as well as for reasons of consumer information and protection (3). In their paper, Schrader et al. (2) present, besides other results, a set of data for a range of skin care products, using the methylene blue test as an indirect method and the image analysis method as a direct method for evaluating skin roughness. On investi- 289

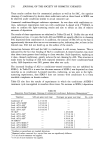
290 JOURNAL OF THE SOCIETY OF COSMETIC CHEMISTS gating the correlation between the results of the methods, they come to the conclusion that "the methylene blue method provides a satisfactory correlation with the image analysis method. It confirms that this simple procedure gives usuable data on the influence of cosmetics on skin roughness." After a reevaluation of the data provided by Schrader et al. (2), the present paper was initially just intended to express some doubts with respect to this conclusion. However, it turned out that a closer look at the data provides, on the one hand, an extended view of certain aspects of the validity and predictive power of both the methylene blue (MB) and image analysis (IA) tests, and, on the other hand, some insight into the general problems of testing skin roughness. RESULTS The data on which this paper is based are taken from Table I in reference 2, and are reproduced here in Table I. The data are normalized mean roughness results and relate to 20 individual values (i.e., to 20 test subjects) for each of 22 skin care products. As described in reference 2, "The 20 individual data sets that were obtained at the begin- ning and the end of each test were normalized. The initial value was set at 100%, so that Table I Data Taken from Table I in Reference 2 for Normalized Mean Skin Roughness Values of 20 Test Persons After Applying 22 Different Skin Care Products and the Ratings of These Products Into Four Classes Methylene blue test Image analysis test Product no. Roughness % Rating Roughness % Rating 1 78.7 + 94.86 2 81.6 + 92.93 3 84.8 + 90.94 4 86.5 q- 93.91 5 88.3 + 95.57 6 88.7 + 95.97 7 90.0 + 94.70 8 90.0 + 97.05 9 94.9 o 97.52 10 98.0 o 92.83 11 98.5 o 92.47 12 98.7 o 97.83 13 100.6 o 95.97 14 103.6 o 97.77 15 104.4 o 102.54 16 105.3 o 102.54 17 105.5 o 97.76 18 109.3 - 98.65 19 110.3 - 102.55 20 113.5 / 57.09 21 114.5 - 94.45 22 122.7 - 95.91
Purchased for the exclusive use of nofirst nolast (unknown)
From: SCC Media Library & Resource Center (library.scconline.org)