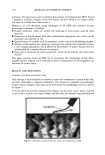
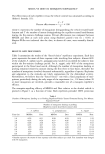
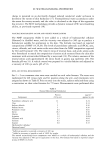
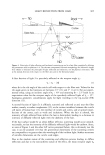
242 JOURNAL OF COSMETIC SCIENCE Table I Composition of Utilized Topical Formulations Component % (w/w) Component % (w/w) A. W/O emulsion Oil phase Cetearyl alcohol White petrolatum Mineral oil Ceteth-20 B. O/W emulsion Oil phase Cetyl alcohol Cetearyl glucoside Jojoba oil Tocopherol Lecithin Ascorbyl palmirate Capric/caprilic triglyceride C. PemMen gel Acrylates/C 10-30 alkyl acrylate Crosspolymer Methylparaben Ethylparaben Propylparaben Triethanolamine Water D. Carbopol gel Carbomer 940 Isopropyl alcohol Mineral oil Methylparaben Ethylparaben Propylparaben Triethanolamine Tetrasodium EDTA Water q.s. q.s. 10.0 7.50 4.00 2.00 2.50 2.00 3.00 0.05 6.00 5.00 2.00 1.00 0.05 0.05 0.05 1.00 to 100 0.80 4.50 2.50 0.05 0.05 0.05 0.80 0.10 to 100 Water phase Glycerine 3.00 Methylparaben 0.05 Ethylparaben 0.05 Propylparaben 0.05 Water q.s. to 100 Water phase Glycerine 4.00 Methylparaben 0.05 Ethylparaben 0.05 Propylparaben 0.05 Citric acid 0.05 Water q.s. to 100 variable-wavelength UV detector, a Rheodine Inc. injection valve, and a Shimadzu integrator. For the analysis of parabens, a Hypersil C18 stainless steel column (25 x 0.46 cm) packed with 5-1nm particles and equipped with a precolumn was eluted with an isocratic mobile phase consisting of acetonitrile/water (40:60 v/v), the flow rate being 1.0 ml/ min, at room temperature, with detection at 260 nm. Extracted samples were quanti- tated by a calibration curve constructed from standard preservative solutions. Quantitative analysis of preservatives was, in addition, performed by UV spectroscopic analysis. The analyses were performed by an NIR Lambda 19 (Perkin-Elmer) spectro- photometer equipped with a double ray and a double monochromator UV-VIS-NIR. DIFFUSION EXPERIMENTS The experiments were carried out using a standard glass Franz diffusion cell (12,13) with

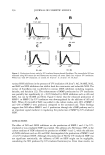
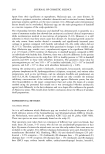
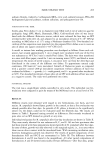
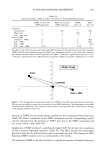
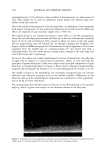
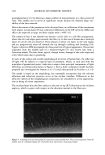
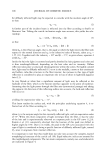
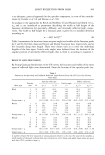
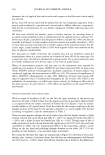
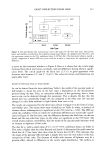
DIFFUSION OF PRESERVATIVES 243 a 1-cm-diameter orifice (0.78 cm 2 area), assembled with a system composed of two different overlapped synthetic membranes: (a) a polydimethylsiloxane-based membrane, 250 pm in thickness (Perthese ©, Dow Corning Corporation, Midland, MI), in contact with the donor phase, and (b) a nylon-based membrane, 150 pm in thickness, 0.22-pm pore size (Alltech Associates Inc., Deerfield, IL), in contact with the receptor phase. As receptor phase, an isotonic solution of 60 mM phosphate buffer, pH 7.4, was used. This solution was always degassed before use and poured in the cell body to overflowing, in order to avoid air bubble formation. To study preservative diffusion, 1 ml of paraben solution or 1 g of the formulation to be analyzed was placed into the donor cell compartment and tamped down on the membranes, previously moistened with the receptor phase. The upper part of the chamber was sealed to avoid evaporation. The receptor phase was stirred by means of a constantly spinning bar magnet and ther- mostated at 37øC. At predetermined time intervals between 1 and 8 hours, samples (0.15 ml) of receptor phase solution were withdrawn and the preservative concentration in the receptor phase was measured using HPLC. Each removed sample was replaced with an equal volume of simple receptor phase. The calculated preservative concentra- tions were plotted as a function of time, and the permeability coefficients were computed from the linear portion of the accumulation curve and expressed both as experimentally observed fluxes (Jo) and as normalized fluxes Jn (Jn = Jo/C, where C is the preservative concentration in the analyzed form, expressed in mg/ml). All the obtained permeation rates were determined six times in independent experiments, and the mean values + standard deviations were calculated. RESULTS AND DISCUSSION PRODUCTION OF TOPICAL FORMULATIONS Four different topical formulations were produced, namely a W/O emulsion, an O/W emulsion, and two hydrophilic gels based on the use of acrylates/C10-30 alkyl acrylate crosspolymer or carboxyvinyl polymer resins. In all formulations a mixture of parabens consisting of MP, EP, and PP was included. In all cases paraben concentrations were 0.05%, w/w (0.5 mg/ml). In Table I are reported the compositions of the paraben- containing formulations. QUANTITATIVE ANALYSIS OF PRESERVATIVES Parabens were extracted by a liquid procedure followed by reversed-phase HPLC analysis as reported in the Experimental section. The method allowed to obtain good separation of the MP, EP, and PP mixture is shown in the chromatograms in Figure 1. Table II reports percentages of recovery of parabens included in the different formulations. In all cases the high percentages of recovery obtained ( than 97%) could suggest the suit- ability of the method for quality control studies. Data obtained by UV spectroscopic analysis confirmed the HPLC analysis results (data not shown). DIFFUSION EXPERIMENTS The experiments described here were performed utilizing an "in vitro" test based on a
Purchased for the exclusive use of nofirst nolast (unknown)
From: SCC Media Library & Resource Center (library.scconline.org)