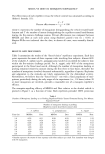
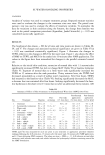
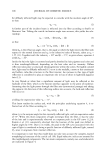
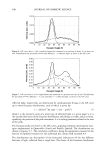
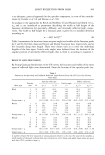
294 JOURNAL OF COSMETIC SCIENCE Table IV Summary of Effects of Skin Treatments on Rate of Moisture Accumulation (MAT) Over Time Site Post-formula Post-formula Post- Post-soak application application Treatment Baseline extraction (15 min after) (30 min after) (4.5 hr after) 1 Untreated 1.6 + 1.5 -- 0.8 + 0.5 1.3 ñ 1.2 1.3 + 1.0 2 Acetone/ether extraction 1.1 ñ 0.8 1.2 _+ 0.9 -- 1.1 + 0.8 1.2 ñ 0.8 3 Water soak 1.1 + 1.0 -- 0.5 ñ 0.5 0.5 ñ 0.3 0.7 ñ 0.7 4 A/E + soak 1.1 ñ 0.8 1.0 ñ 0.9 0.3 ñ 0.3 0.4 ñ 0.3 0.5 ñ 0.4 5 Untreated + vehicle 1.4 ñ 1.4 -- -- 0.8 ñ 0.7 1.3 _+ 1.3 6 Untreated + NMF 1.4 ñ 1.1 -- -- 2.6 ñ 2.0 1.5 ñ 1.3 7 A/E + vehicle 0.9 -+ 0.6 0.9 ñ 0.6 -- 0.7 ñ 0.4 1.0 + 0.8 8 A/E + NMF 1.0 ñ 1.3 1.1 _+ 1.1 -- 1.9 ñ 1.2 1.4 + 1.3 9 Soak + vehicle 1.0 + 0.5 -- 0.5 + 0.3 0.6 _+ 0.3 0.5 ñ 0.2 10 Soak + NMF 1.4 + 1.0 -- 0.6 ñ 0.3 1.7 ñ 1.1 0.7 ñ 0.4 11 A/E + soak + vehicle 1.0 ñ 1.0 1.6 _+ 1.5 0.3 ñ 0.1 0.4 ñ 0.3 0.6 + 0.4 12 A/E + soak + NMF 1.0 + 0.9 1.4 + 1.2 0.2 _+ 0.2 1.5 _+ 1.3 0.9 ñ 0.5 The rate of moisture accumulation (MAT) (cru/sec) was measured for each site prior to any treatment or application procedure (baseline reading), following the A/E extraction, 15 minutes after the water soak, 30 minutes after NMF application, and 4.5 hours following NMF treatment. The values are reported as slope of the regression line and are mean ñ SEM, n = 11. (For abbreviations, see footnote to Table III.) Table V Summary of Effects of Skin Treatments on Baseline Hydration at Various Times Post-formula Post-formula Post- Post-soak application application Site Treatment Baseline extraction (15 rain after) (30 min after) (4.5 hr after) 1 Untreated 12.7 ñ 3.5 -- 9.25 + 2.1 10.7 _+ 3.0 12.3 ñ 3.0 2 Acetone/ether extraction 10.6 ñ 2.1 14.5 ñ 2.1 -- 13.7 + 3.0 11.3 + 2.6 3 Water soak 10.4 ñ 3.0 -- 6.4 + 1.4 7.2 -+ 1.5 6.1 ñ 1.8 4 A/E + soak 10.8 ñ 3.1 11.7 ñ 2.9 4.2 + 1.4 5.1 + 1.5 4.3 + 1.0 5 Untreated + vehicle 10.7 ñ 2.7 -- 12.6 + 2.9 12.0 ñ 3.9 6 Untreated + NMF 12.4 ñ 2.6 -- -- 21.8 + 5.9 12.7 + 3.9 7 A/E + vehicle 10.0 ñ 1.5 13.8 + 1.9 -- 11.5 + 3.4 9.1 + 1.6 8 A/E + NMF 12.4 ñ 2.1 15.7 ñ 4.0 -- 19.9 + 4.7 12.8 ñ 2.5 9 Soak + vehicle 9.9 ñ 1.6 -- 5.78 ñ 1.2 7.3 + 1.9 8.33 + 2.2 10 Soak + NMF 13.4 ñ 2.4 -- 6.78 ñ 1.0 15.1 ñ 2.6 9.3 ñ 1.7 11 A/E + soak + vehicle 13.2 ñ 2.3 16.3 ñ 3.6 3.7 + 1.0 6.0 + 1.0 5.8 ñ 1.5 12 A/E + soak + NMF 12.2 ñ 3.5 10.6 ñ 2.8 7.3 ñ 1.5 16.6 ñ 5.9 9.9 -+ 3.2 The skin hydration (cru) was measured for each site prior to any treatment or application procedure (baseline reading), following the A/E extraction, 15 minutes after the water soak, 30 minutes after NMF application, and 4.5 hours following NMF treatment. The values are mean ñ SEM, n = 11. (For abbreviations, see footnote to Table III.) extraction followed by a water soak resulted in TEWL, MAT, and baseline hydration profiles similar to those of the individual A/E and soak treatments (Table VI). Application of the NMF resulted in significantly lower TEWL for the untreated control, the A/E extracted site, and the water-soaked site after thirty minutes (Table VI). The TEWL was directionally lower 30 minutes after NMF treatment for the A/E-plus- water-soak site. The significant decrease in TEWL for the A/E site and the directional

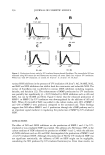
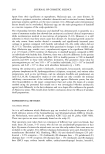
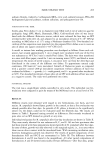
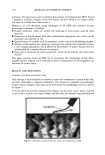
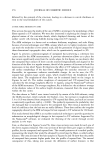
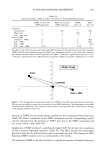
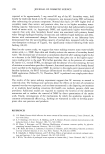
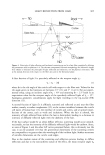
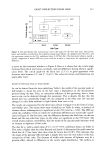
SC WATER-HANDLING PROPERTIES 295 Table VI Statistical Analysis of Effects of Skin Treatments on Instrumental Measurements TEWL 30 min after MAT 30 min after TEWL MAT NMF application NMF application after 4 hr after 4 hr Treatment Acetone/ether •' ND •' ND Water soak A/E + water soak Effect of NMF Untreated + NMF ,[, •' ,[, ND A/E + NMF $ • $ NO Soak + NMF ,[, •' ,[, $ (d) A/E + soak + NMF The effects of the A/E extraction, water soak, and NMF treatment for the respective sites on barrier integrity (TEWL) and SC water-handling properties (MAT) were determined relative to the initial skin condition. The changes and associated statistical significance are shown. •' indicates a significant increase (p • 0.05), ,• indicates a significant decrease, ND indicates no significant difference, and (d) is a difference atp • 0.07. Soak Water Soak ] • , ,• Untreate -1 1 1 -1 Soak + NMF -2 -3 Figure 1. The changes from baseline skin condition in TEWL versus MAT are shown for one of the sites. The site was first soaked in water and then treated with an NMF formulation. The measurements were made 30 minutes after application. The numerical values shown in the figure have been normalized for changes in the parallel untreated control site. decrease in TEWL for the extracted-plus-soaked site were maintained four hours later (Table VI). Direct comparison of the NMF treatments with the corresponding vehicle controls indicated that the decreases in TEWL were due to the NMF components and not to the vehicle itself (Table VI). Application of NMF produced a significantly higher MAT for all four skin conditions at thirty minutes following treatment (Table VI). The MAT increase was maintained four hours later for the A/E-extraction-plus-water-soak site only. The changes in MAT following NMF treatment were not attributable to the vehicle. The addition of NMF to the skin resulted in a significant increase in baseline hydration
Purchased for the exclusive use of nofirst nolast (unknown)
From: SCC Media Library & Resource Center (library.scconline.org)