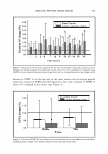
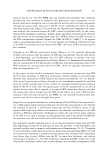
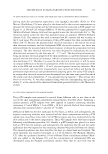
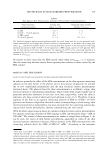
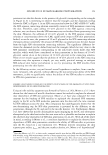
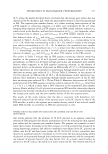
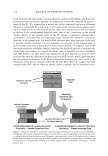
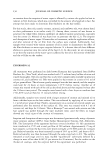
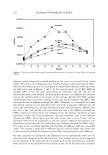
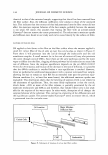
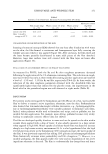
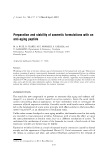
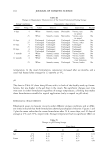
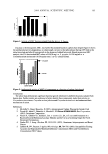
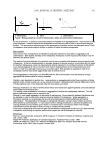
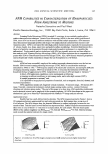
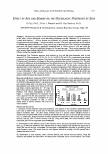
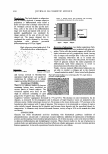
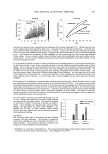
A B C Figure 3. Scanning electron microscopy micrographs of the skin surface (A) before application, (B) one hour after application, and (C) six hours after application.

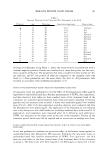
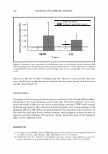
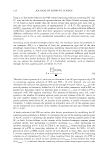
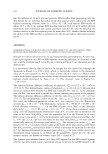
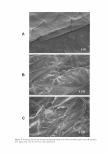
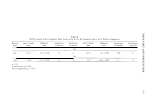
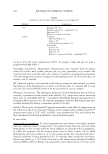
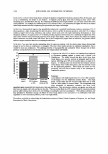
Table II FOITS Analysis of Skin Roughness: Mean Values of the Rz and Ra Parameters After 3 and 8 Weeks of Application Baseline After 3 weeks Difference Significance Significance After 8 weeks Difference Significance (µm) (µm) (µm) vs baseline vs placebo (µm) (µm) vs baseline Rz ..._ 139.L 133.5 -5.9 (-4.5%) s s 137.9 -1.5 (-1.0%) NS Ra 24.(1 22.8 -1.2 (-5.3%) s s 23.2 -0.8 (-3.0%) s n = SL[. S: significance, p 0.05. NS: no significance, p 0.05. Significance vs placebo s s u - C/) C/) 0 b:i t'I1 z ...., - � � - z � t'I1 'TI - r � """"' VI vJ
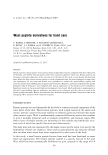
Purchased for the exclusive use of nofirst nolast (unknown)
From: SCC Media Library & Resource Center (library.scconline.org)