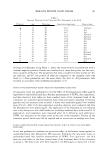
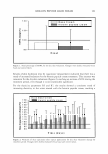
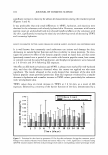
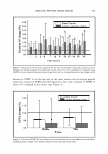
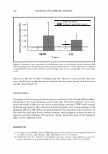
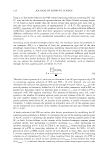
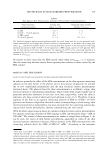
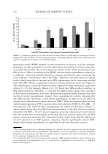
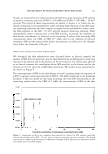
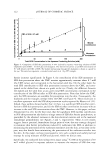
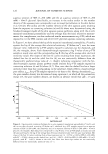
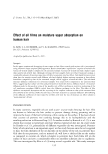
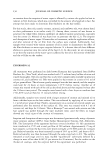
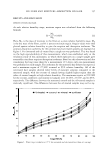
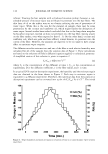
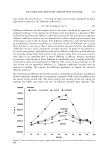
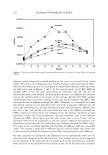
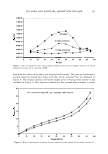
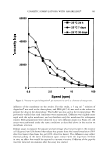
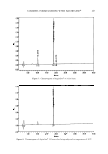
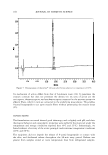
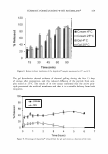
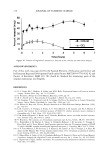
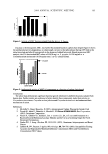
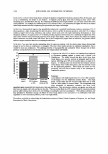
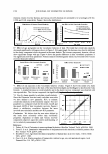
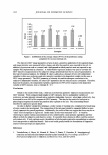
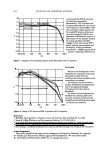
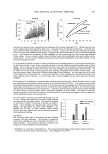
2006 ANNUAL SCIENTIFIC MEETING 187 Results The analysis of data from three distinct time periods each provided similar answers to the questions posed. 1. Graphing 5000 or more data points of axillary sweat output shows that these data are skewed and explains the use oflog transformation for comparison of treatment effects. 2. Individual average baseline milligram sweat output over time The graph of a specific individual subject's sweat output over time indicates consistent variability of output between 200 and 600 milligrams, another subject's output varies from 800 to 1200 milligrams. These are indicative of the patterns of output for subjects in general. Additionally, the patterns do not show any increasing or decreasing trend in milligram sweat output. 3. Consistency of individual right over left axilla output ratios ( sweat output from the right axilla divided by sweat output from the left axilla) Viewing right over left ratios of milligram output over a long period indicates consistency. Data from one subject indicates an average ratio of 1.0 with a range from 0. 8 to 1. 2. Another subject is similarly consistent with a mean around 0. 8 and a range from 0.6 to 1.0. These are representative of the panel of subjects at large. 4. Seasonal sweat output: Winter vs. Summer In an attempt to determine whether subjects sweat more in the summer than the winter, we plotted the difference between subject's average output during summer months and winter months. The mean difference was essentially zero. 5. Relationship between baseline milligram sweat output and age and body weight Milligram output does not seem to be a function of age nor is sweat output related to body weight. 6. Relationship between efficacy (Percent Reductions) and age, body weight and baseline sweat output. Our historical data do not indicate a relationship between product efficacy and age. Similar profiles are seen in older and younger test subjects. Our data also indicate that efficacy is not related to sweat output nor is it related to body weight. 7. Daily variation in percent reduction (day to day). Individual subjects efficacy will vary from day to day, despite a treatment showing consistent efficacy (i.e. consistent percent reduction estimate from one evaluation time point to the next). 8. A comparison of percent reductions indicates that product efficacy is not related to gender. Conclusions Reviewing data from three time points over the past few decades confirms our original conclusions concerning some of the myths of axillary sweat output and the evaluation of antiperspirant products.

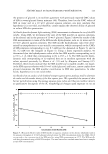
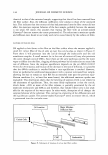
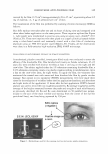
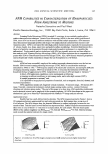
188 JOURNAL OF COSMETIC SCIENCE AN OVERVIEW OF ANTIPERSPIRANT AND DEODORANT TESTING Linda P. Oddo, James P. Bowman and John E. Wild Hill Top Research 1. INTRODUCTION Benefiting from 40 years of conducting and designing antiperspirant and deodorant efficacy studies, a brief overview of the ,study methods and guidelines, critical study controls, screening methods and FDA requirements will be presented. Included will be a comparison of the original 1975 self perception data used to establish the current FDA minimum efficacy requirement to recent self perception information. 2. PURPOSE This presentation will provide an overview of deodorant and antiperspirant efficacy testing. 3. DISCUSSION 3.1 Guidelines for Antiperspirant Testing Since antiperspirants affect the function of the body by inhibiting perspiration, they are considered an OTC drug. As OTC drugs, their labeling and claims are regulated by the Antiperspirant Drug Products for Over-the-Counter Human Use Final Monograph (effective on December 9, 2004). 1 Testing requirements according to: (1) qualification and restrictions of test subjects, (2) requirements for hotroom or ambient testing conditions, (3) study procedures, and ( 4) data analysis. Requirements for establishing minimum antiperspirant efficacy, and for supporting enhanced duration and extra effective claims are also specified. The testing guidelines will be presented and discussed. 3.2 Antiperspirant Screening Studies Screening studies provide reduced cost options for predicting antiperspirant efficacy. These include, (1) modifying the standard design by decreasing the number of subjects, product applications and/or collections, (2) using the back as a test site for sweat collections2, allowing several products to be evaluated at the same time, and (3) the starch iodine procedure. 3.3 FDA Monograph - Subject Self-Perception of Sweat Reduction The objective of the current research was to determine if the original self-perception data presented to the OTC Panel for Antiperspirants in 1975 by Carabello and Majors would be the same or similar to current consumer opinion. Subjects participating in the original research completed questionnaires indicating if they noticed a difference in wetness between underarms. It was the relationship of self-reported efficacy to gravimetric measurements that the OTC panel used to determine when noticeable antiperspirant effect was observed and establish the current minimum 20% reduction requirement. Results from recent self-perception research will be compared to the earlier data. 3.4 Deodorant Efficacy Testing Procedures Since underann deodorants are designed to reduce or prevent the formation of malodor, they are regulated as cosmetics and are not subject to a specific regulatory monograph. Industry guidelines have been provided in the American Society for Testing Materials' (ASTM) Standard Practice for the Sensory Evaluation of Axillary Deodorancy. 4 The practice recommends study procedures for using odor judges to determine product efficacy and specifically addresses: (1) selection and training of odor judges, (2) qualification and restrictions of test subjects, (3) study design, (4) sensory scale options, and ( 4) data analysis. The document does not include a discussion of claims The ASTM testing guidelines will be presented and discussed.
Purchased for the exclusive use of nofirst nolast (unknown)
From: SCC Media Library & Resource Center (library.scconline.org)