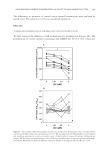
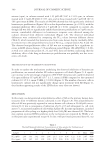
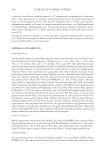
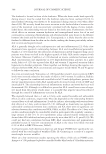
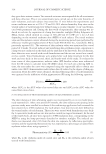
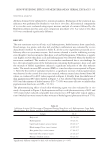
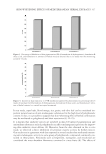
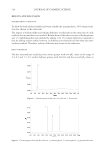
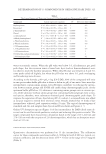
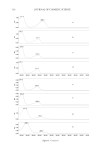
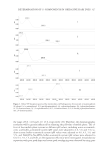
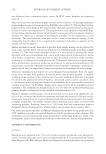
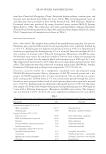
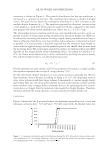
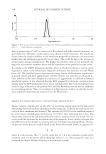
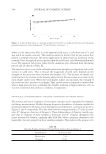
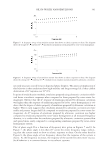
JOURNAL OF COSMETIC SCIENCE 338 than or greater than 25 mV is indicative of fl occulated and defl occulated emulsions, re- spectively (18). Therefore, no fl occulation was shown in both emulsions. The results in- dicated that the droplet stability in the emulsions prepared by ultrasonic cavitation was higher than the emulsions prepared by rotor–stator. This could be due to the increase in energy input during emulsifi cation. The higher the absolute value of zeta potential, the larger the electrostatic repulsive forces and the separation of the particles become easier. According to the DLVO (Derjaguin–Landau–Verwey–Overbeek) theory, a system can be regarded as stable if the electrostatic repulsion dominates the attractive van der Waals force (19). The particles have to overcome an energy barrier of electrostatic repulsion to approach closely and form agglomerates. Smaller droplet size provides an enhanced ki- netic stability in the inner droplets to coalescence or agglomerate in addition to lowered interfacial tension. It was observed that the EDS prepared by ultrasonic cavitation were smaller than the EDS prepared by rotor–stator emulsifi cation. The very small droplet size caused a large reduction in the gravity force, and the Brownian motion may be suffi cient in overcoming gravity. Thus, no creaming or sedimentation could occur and the electro- static repulsion dominates the attractive van der Waals force. RHEOLOGICAL CHARACTERIZATION 1: VISCOSITY VERSUS SHEAR RATE PLOT Figure 3 shows a log/log plot on the effect of increasing energy input on the functional relationship between viscosity and shear rate for emulsions. A drastic decrease in the vis- cosity of these emulsions was observed. The viscosity of 109.69 Pa·s for emulsion prepared by rotor–stator emulsifi cation decreased to 70.79 Pa·s after sonication for 5 min. The interactions between the emulsion molecules will be weakened and, as a result, the vis- cosity would be decreased by the destruction of the network. It was clearly indicated that the differences in the changes in viscosity were not very large, but still signifi cant. The lin- ear portions of the plots are readily fi tted to the Power Law model shown in equation (3): η = kỳn - 1 (3) where η is the viscosity (Pa·s-1), ỳ is the strain rate (s-1), k is the consistency index of the emulsion, and n is the power (shear thinning) index (n 1). Decreasing the value of n increased the degree of shear thinning of the emulsion system. Figure 2. The zeta potential of emulsions measure for emulsion prepared by using rotor–stator homoge- nizer ( ) and ultrasonic cavitation ( ).

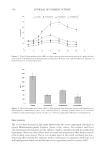
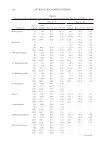
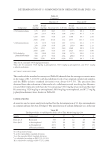
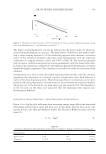
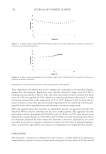
OIL-IN-WATER NANOEMULSIONS 339 The degree of pseudoplasticity can also be indicated by the power index (n), which de- creases when pseudoplasticity increases. The applicability of the Power Law model exhib- ited n values ranging between 0.14 (for emulsions prepared with ultrasonic cavitation) and 0.18 (for emulsions prepared with rotor–stator homogenizer) with the regression coeffi cients (r2) ranging between 0.9912 and 0.9973 (Table II). The emulsion prepared with ultrasonic cavitation was found to be more pseudoplastic with the lowest fl ow index. In terms of the consistency coeffi cient (k), the emulsions prepared with ultrasonic cavitation showed the higher consistency. The consistency is an indicator of the viscous nature of the emulsion. At high shear rates, there is some discernible departure from linearity, with the curvature suggesting the attainment of a constant viscosity at high shear rates. Such behavior is expected for shear-thinning systems. Shear-thinning behavior in emulsions can be inter- preted as indicating the presence of weak attractive forces between the emulsion droplets, which give rise to the formation of a weak elastic gel-like network (20). The dependence of the viscosity on the shear rate indicated that the emulsions were typical non- Newtonian in behavior. RHEOLOGICAL CHARACTERIZATION 2: SHEAR STRESS VERSUS SHEAR RATE PLOT Figure 4 is a log/log plot indicating how increasing energy input affects the functional relationship between shear stress and shear rate. It also shows that the data can be ade- quately fi tted to the Herschel–Bulkeley model. The Herschel–Bulkeley model takes the form (21): τ = τ0 + kHBỳα (4) Figure 3. Rheological characterization of 30% w/w palm oil esters-in-water emulsions prepared using rotor–stator homogenizer ( ) and ultrasonic cavitation ( ). Table II Power Law Parameters Obtained From the Data Shown in Figure 3 Fitting to the Power Law Equation Emulsifi cation n k r2 Rotor–stator 0.18 10.6 0.9973 Ultrasonic 0.1378 13.84 0.9912
Purchased for the exclusive use of nofirst nolast (unknown)
From: SCC Media Library & Resource Center (library.scconline.org)