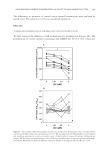
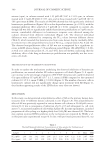
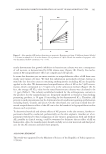
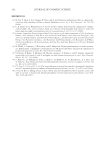
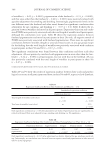
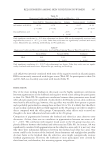
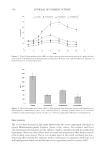
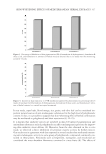
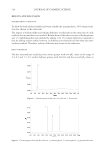
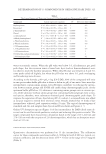
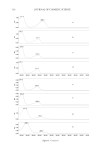
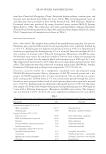
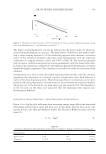
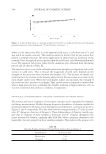
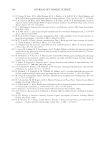
JOURNAL OF COSMETIC SCIENCE 340 where τ is the shear stress (Pa), τ0 is the apparent yield stress, ỳ is the shear rate (s-1), and kHB and α are model constants. The model accounts for the fact that for any system that possess a network structure, the initial application of shear results in distortion of the network. Once the applied stress is greater than the yield stress, non-Newtonian fl ow will occur. The apparent yield stress values for the emulsions were obtained from the fi tting process and are shown in Table III. The attractive force is one of the colloidal interactions and plays an important role in the increase in yield stress. This is because the magnitude of yield stress depends on the strength of the attractive force between the droplets (22). The decrease of droplet size resulting from the increase in the disperse phase volume fraction causes an increase in the total droplet surface area. When the total droplet surface area increases, the strength of the attractive force increases accordingly. Thus, greater stress is required to initiate fl ow when a high attractive force is holding the droplets resulting in high yield stress (22). A very low yield stress may indicate a tendency to separation. RHEOLOGICAL CHARACTERIZATION 3: FREQUENCY DEPENDENCE OF DYNAMIC MODULI The viscous and elastic responses of viscoelastic systems can be quantifi ed by dynamic oscillatory measurements. Profi les showing frequency dependence of dynamic moduli for emulsions prepared with rotor–stator homogenizer and ultrasonic cavitation are given in Figures 5 and 6, respectively. The data show how the storage modulus, G′ and loss mod- ulus, G″ change as a function of frequency. These ω dependence of dynamic moduli sug- gest that G′ response of these samples is dominant over G″ response throughout the entire measured ω domain, implying that solid-like (elastic) property dominates over liquid-like (viscous) property in these emulsion samples. This indicates the presence of a Table III Herschel–Bulkeley Parameter Obtained From the Data Shown in Figure 4 Emulsifi cation Yield stress (Pa) Rotor–stator 7.29 Ultrasonic 10.98 Figure 4. A plot of shear stress as a function of shear rate for 30% w/w palm oil esters-in-water emulsions prepared using rotor–stator homogenizer ( ) and ultrasonic cavitation ( ).

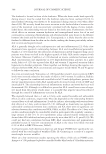
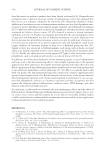
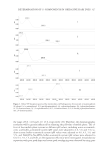
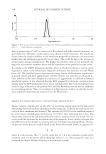
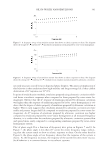
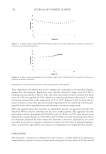
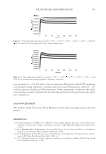
OIL-IN-WATER NANOEMULSIONS 341 network structure created between dispersed phase droplets. The practical implication of this behavior is that emulsions show high stability and longer storage life if they exhibit domination of G′ response over G″ (23). In point of emulsifi cation methods, emulsions prepared using ultrasonic cavitation exhib- ited better viscoelastic responses when compared to those prepared by rotor–stator ho- mogenizer. The fact that the G′ response of emulsions prepared by ultrasonic cavitation was higher than the response of emulsions prepared by rotor–stator homogenizer is evi- dence that the degree of elastic property of emulsions prepared by ultrasonic cavitation is higher. This in turn suggests that emulsions prepared by ultrasonic cavitation are more stable and possess longer shelf life compared to emulsions prepared by rotor–stator ho- mogenizer. As G″ response of emulsions prepared by ultrasonic cavitation was higher compared to emulsions prepared by rotor–stator homogenizer at all measured frequency domains, it is evident that the emulsions prepared by ultrasonic cavitation systems fl ow and spread more easily compared to corresponding emulsions prepared by rotor–stator homogenizer system. Plot of phase angle δ as a function of frequency ω is given in Figures 7 and 8. In Figure 7, the phase angle is less than 20° across the entire frequency range, indicat- ing that the system tends to show an elastic response to shear. On the other hand in Figure 8, the phase angle at low frequency shows that the response of the system is elastic. As the frequency increases, the response of the system becomes more viscous. Such behavior is a common feature in viscoelastic systems. Figure 5. A frequency sweep of an emulsion system that shows an elastic response to shear. The diagram shows the storage (G′ ) and loss (G″ ) moduli for an emulsion system prepared by rotor–stator homogenizer. Figure 6. A frequency sweep of an emulsion system that shows an elastic response to shear. The diagram shows the storage (G′ ) and loss (G″ ) moduli for an emulsion system prepared by ultrasonic cavitation.
Purchased for the exclusive use of nofirst nolast (unknown)
From: SCC Media Library & Resource Center (library.scconline.org)