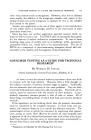
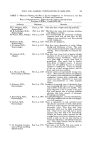
CONSUMER TESTING AS A GUIDE FOR TECHNICAL RESEARCH 107 importance to the technologist. In the first place, the use of a large group to express a preference for one of two products is obviously better by sheer weight of numbers than the opinion of any small panel. In the second place a consumer test gives the research man evidence directly from consumers which is more valuable than his own opinion or the opinion of a group of his technical co-workers when he reaches the all- important stage of recommending a development to his management. Third, when this kind of guidance is available early in the development program it can prevent a costly waste of research time. Without this kind of •guidance it is very possible to •ork long and hard perfecting a develop- ment only to find out later that certain 'features which seem technically desirable are undesirable from a consumer standpoint. One of the problems of the food technologist which is probably shared in common with the cosmetologist is that no one person or no small group is really qualified to predict consumer reaction to any new combination of taste, flavor, odor, texture, etc. There is no reason why any one person or any small group should be representative of the consumer group as a whole. The seriousness of this fact becomes apparent when we consider that, in a highly competitive field, manufacturers must be concerned with preference ratios of 1.5:1 and even less. Often a manufacturer may de- cide in favor of a product which shows only a 56 to 44 per cent preference margin over an alternative product. This corresponds to a preference ratio of 1.3:1. Consumer testing procedures are less precise than most people realize. It is axiomatic that safety lies in numbers. Obviously one can place greater reliance in a test in which 1000 people have expressed their preference than in a test of only 50 people. How much greater confidence, involves us in a consideration of statistical interpretation. The necessary statistics are clearly described in a number of texts on the subject (1, 3, 4) and are very useful for defining the degree of confidence which can be placed in any given test. The data in the following tables have been calculated to show the limitations and qualifications of various sizes of panels for paired preference consumer tests. TABLE 1--CA•'XBXLXT¾ Or PaSELS roe. Cossvu•v. T•sxxsG (Pv.•r•v. Esc• roe. Exx•v. or Two S•uvL•s) Panel Least Significant Panel Least Significant Size Pre•rence,% Size Pre•rence,% 15 75.3 75 61.3 25 69.6 150 58.0 50 63.9 300 55.7 Table 1 shows some of the obvious limitations of small panels with respect to their ability to evaluate small preferences between two samples.

108 JOURNAL OF THE SOCIETY OF COSMETIC CHEMISTS In the food field it is common practice to use small panels to judge flavor and texture quality. This table indicates, for example, that unless a panel of 25 finds a preference of at least 69.6 per cent one cannot place much con- fidence in the result. That is, a preference of less than 69.6 per cent can occur so frequently by chance alone that the research man cannot be sure it represents any real preference. It can be noted, however, that with a panel of 300 this situation has been improved considerably, in that a pref- erence as small as 55.7 per cent for one sample is significant at the $ per cent level. That is, a panel of this size will find a preference of 55.7 per cent only $ times in a hundred when the samples under comparison are either identical or equal in acceptability. Of course larger consumer panels permit measurement of even smaller preferences or will lend an even greater degree of significance to a given magnitude of preference. The least significant preference for any given panel size is easily calculated from common statistical procedures (1, 3, 4). TABLE 2--CAPABILITY OF PANELS FOR CONSUMER TESTING (PREFERENCE FOR EITHER OF Two S•.MPLES ) Panel Size "False Alarm"-- Chances of Reporting 60% Preference Where None Exists "Missing the Boat"-- Chances of Failing to Find a Significant Preference When True Preference Is 60% 15 67 in 100 88 in 100 25 40 in 100 83 in 100 50 20 in 100 70 in 100 75 14 in 100 59 in 100 150 2 in 100 31 in 100 300 1 in 100 7 in 100 The data in Table :2 show, in the "False Alarm" column, a different as- pect of the data given in Table 1. Here the assumption is made that we have decided we are interested in a preference of 60 per cent for one sample over the other (which would, of course, have a preference of 40 per cent). The "False Alarm" column shows that even a panel of 25 might report a preference of 60 per cent as often as 40 times in 100 tests. A panel of 50, however, is a little better in that this size panel would report a 60 per cent preference only 20 times in 100 when no real preference existed. To help make this clear, it should be emphasized that these figures actually mean that if panels of the sizes shown in the table are asked to express a prefer- ence between two identical samples, they would report 60 per cent pref- erences as frequently as indicated in the table. Going to the other extreme of the table, it is easy to see that these "False Alarm" results occur much less frequently, or only one time in a hundred, with a panel of 300. Table 2 also shows, in the "Missing the Boat" column, some information as to what will happen with panels of this size when they are comparing
Purchased for the exclusive use of nofirst nolast (unknown)
From: SCC Media Library & Resource Center (library.scconline.org)