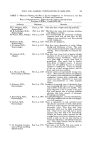
CONSUMER TESTING AS A GUIDE FOR TECHNICAL RESEARCH 109 two samples, one of which is actually preferred to the other by 60-40 per cent margin. That is, these are hypothetical samples, about which we know, presumably from exhaustive testing, that one is preferred to the other by 60 per cent of the total population. The "Missing the Boat" column shows that a panel of 25 would fail to report a significant preference 83 per cent of the time. That is, if we ran 100 tests, each with a different panel of 25 people, we could expect to "Miss the Boat" with 83 of these tests. Similarly a panel of 50 persons would have failed to report a significant preference or will "Miss the Boat" 60 times in 100. Again we can note that the "Missing the Boat" odds are much more favorable with the larger panel sizes. We will "Miss the Boat" only 7 per cent of the time with a panel of 300. TABLE 3--CAPABILITY OF PANELS FOR CONSUMER TESTING (PREFERENCE FOR EITHER OF Two SAMPLES) Panel Size "False Alarm"-- Chances of Reporting 70% Preference where None Exists "Missing the Boat"-- Chances of Failing to Find a Significant Preference When True Preference is 70% 15 20 in 100 66 in 100 25 6 in 100 48 in 100 50 1 in 100 19 in 100 75 1 in 100 7 in 100 150 1 in 100 1 in 100 300 1 in 100 1 in 100 The weaknesses of small panels are even more dramatically illustrated in Table 3. All panels from 25 in number up to 300 perform reasonably well as regards the likelihood of reporting preferences as large as 70 per cent when, in fact, the samples being compared may be identical. How- ever, when we consider the danger of missing a true preference as great as 70 per cent it is apparent that small panels still leave us in serious difficulty. A panel of 25, as shown in the "Missing the Boat" column, may fail to report a significant preference 48 times in 100 when in fact one sample is preferred to the other by 70 per cent of the consumer public (again assum- ing we have two samples whose preference is well established). Only when we use a panel of at least 75 people do we approach a satisfactory assurance that our panel will not fail to find this important 70 per cent preference. Obviously the larger panels are even better. What do the above figures really mean? They are simply statistical calculations which represent the best performance one can expect fi'om panels randomly selected from the universe or population to be sampled. If conditions are less than ideal our panel performance will be even poorer than this. For example, if a panel is drawn from any limited group such

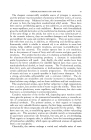
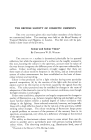
110 JOURNAL OF THE SOCIETY OF COSMETIC CHEMISTS as the secretarial staff of a large office building, there may be a tendency toward a bias in that group. The data in the above tables may apply only to the preferences of similar groups of secretaries with similar environ- ment, background, economic status, and tastes. The results of the test may have little relationship to the likes and dislikes of the total consumer group for whom the product is designed. We have no statistical method of measuring the relationship of pref- erence judgments from-such a group as compared to a total population of a city, state, or country. Such a correlation can be established only by testing each group to measure the diversity of likes and dislikes. Even when this information has been obtained it cannot be used in most cases to apply to any other set of samples. Therefore, it behooves the researcher to select his sample as representatively as possible from the type of people whose opinions he wishes to measure. The data in the above tables which show the chances of failing to find real preferences with a panel of a given size can also be presented in graph- ical form as in Fig. 1. This chart consists of so-called power curves (2). The use of these curves permits reading directly, for a given size panel, the chances of "Missing the Boat." Another way of expressing the reliability of consumer test results is by showing the precision limits or the range within which the true preference 1.00 o.oo 0.80 0.70 0.60 0.50 0.40 0.30 0.20 0.10 0.0 1.00 50 80 55 60 65 70 75 True Preference •/o) • = 0.05 Power curves for panel performance of different size N o.o 0.10 0.20 0.30 0.40 0.50 0.60 0.70 0.80 o.oo
Purchased for the exclusive use of nofirst nolast (unknown)
From: SCC Media Library & Resource Center (library.scconline.org)