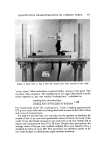
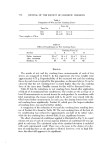
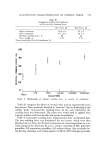
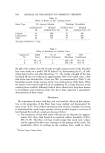
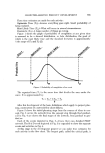
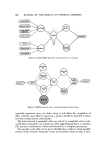
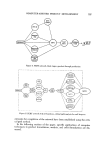
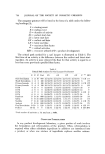
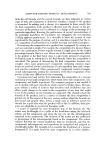
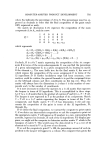
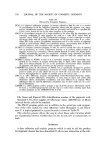
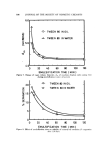
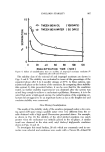
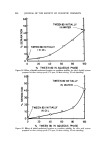
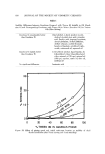
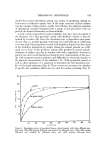
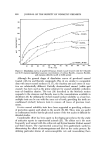
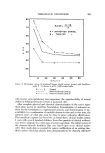
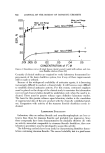
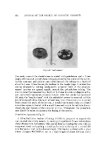
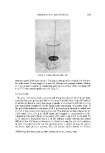
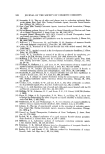
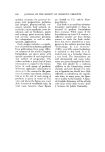
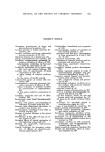
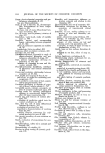
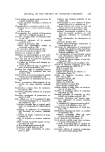
COMPUTER-ASSISTED PRODUCT DEVELOPMENT 785 Three time estimates are made for each activity: Optimistic Time (To)-Assume everything goes right. Small probability of being realized. Most Likely Time (T•t)-What will occur in normal circumstances. Pessimistic (T•,)-A large number of things go wrong. Figure i shows the graph of probability of completion at any given time is assumed to be a skewed distribution, or beta distribution the peak of which is the most likely time and the standard deviation is approximately •t• the range of T•, and To (2). to tm tp Figure 1. Probability of completion of an event The expected time (To) is the mean time that divides the area under the curve. It is approximated by: Te = To + 4 T:u + Te 6 After this development of the basic definitions which apply to project plan- ning, construction of a network flow sheet follows. Figure 2 shows the initial planning steps from the sources of ideas to con- cept, Fig. 3 carries the network from the concept step through final product, and in Fig. 4 are shown the final stages of the network, h'om product to pro- duct:on. Each of the events depicted in Figs. 2-4 have their own detailed PERT network. The R & D event depicted in Fig. 3 is expanded to show the separate events and activities in Fig. 4. At this stage in the development project we can make time estimates for each activity in the flow sheet. The longest path, called the critical path, is

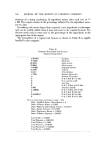
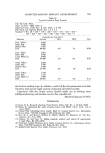
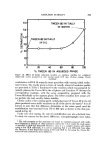
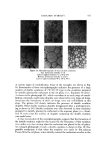
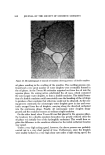
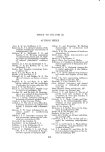
786 JOURNAL OF THE SOCIETY OF COSMETIC CHEMISTS INVENTORS Figure 2. Initial PERT network-sources of ideas to concept Figure 3. PERT network-from concept through product stage especially important since any delay aIong it wiII affect the completion of other activities. Any effort to speed up a proiect should be directed to those activities comprising the critical path. The total network is upgraded when an activity is completed and an esti- mated time is changed to an ,actual time. This upgrading produces a consider- able amount of calculations which lend themselves to computer processing. The specific events (Fig. 5) are given identification numbers which simplify analysis of the network. Using the events and activities shown in Fig. 5, time
Purchased for the exclusive use of nofirst nolast (unknown)
From: SCC Media Library & Resource Center (library.scconline.org)