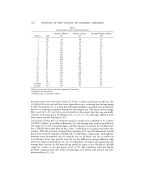
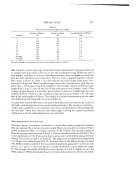
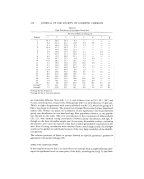
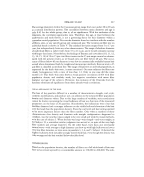
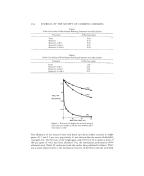
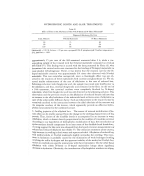
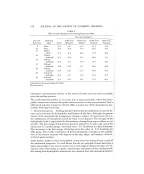
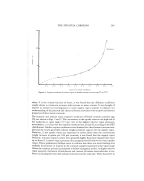
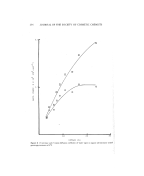
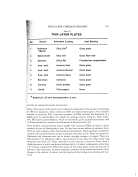
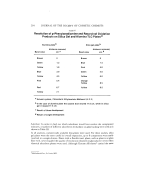
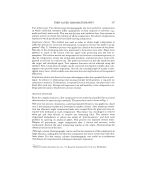
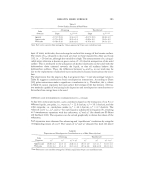
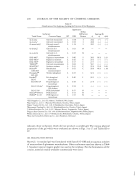
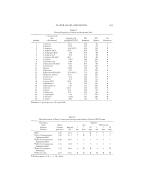
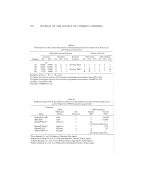
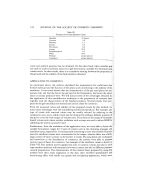
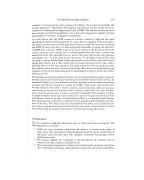
FEMALE SCALP Table II Fiber and Site Count on Right Side of Head 223 Number of Fibers/ Number of Sites/ Average Number of Fibers/ Subject cm 2 cm 2 Site 2 175 68 2.6 3 169 83 2.O 4 142 81 1.7 10 270 105 2,6 12 208 73 2.8 14 182 83 2.2 15 239 ,100 2.4 18 203 70 2.9 Average 199 85 2.4 Average a 204 89 2.3 alert side of head for same group of subjects, derived from values in Table I. • Hair is known to grow in groups on the skin of lower mammals (27), primates (28), and on certain body areas of man (20, 21, 22, 29, 30) including the scalp. Within the site of such groups, each fiber is at most a few diameters away from its neighbors, while the sites are well separated from each other. The site count, obtained together with the fiber count, is shown in Table I. It is seen that the site count ranges from about 50 to just over 100 per cm 2. Based on the average values, the centerpoints of such sites are more than 1 mm distant from their neighbors. The average number of fibers per site ranges from 1.8 to 3.3, but 90 per cent of the participants were between 2 and 3. The number of sites showed a reasonably good positive correlation (0.800) with the total ß : number of fibers. However, the correlation with age was even weaker (-0.518) than that of the total number of fibers. The results of a second measurement on the right :.: side of the head of 8 individuals are given in Table II. It is seen that sizeable differences can exist in both fiber and site count on the 2 sides of the head, even though they were symmetrically positioned. The variation is randomw neither side is preferred--as is shown by the close correspondence of the averages for the two sides. These facts indicate that, while single counting for a panel is probably satisfactory, it may be misleading for any one individual. FIBER DISTRIBUTION BY GROUP SIZE The term "group" is used here to describe 2 or more fibers within a single site, whether they are separated by stratum corneum (simple fibers) or issue from a common follicle orifice (compound fiber) or contain a mixture of the 2 forms. The average number of fibers in a group varied between 1.8 and 3.3 for our panelists, as shown in Table I. The actual distribution of the fibers according to group size varied widely among the indi- viduals. The results are given in Table III. The proportion of single fibers ranged from 1 to 23 per cent within the panel of 20. On some subjects, the largest groups contained only 4 fibers while on others 8. Even an identical maximum group size--as seen on sub- jects 1, 4, 5 and 17--does not ensure a similar distribution curve within the range. On the average, two-thirds of all fibers were in groups of 2 and 3, slightly more in the latter category. When the group frequency is expressed as a function of size, the results

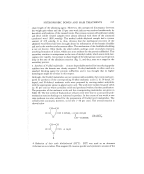
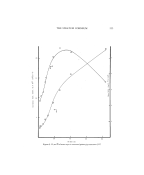
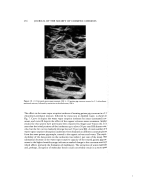
224 JOURNAL OF THE SOCIETY OF COSMETIC CHEMISTS Table III Fiber Distribution According to Group Size Per Cent of Fibers in Groups of: Subject 1 2 3 4 5 6 7 8 1 14.7 46.3 34.7 4.2 -- -- -- • 2 6.4 31.4 42,3 12.8 3.2 3.8 -- 3 6.1 62.6 25.8 2.5 3. l -- -- 4 23.4 47.5 26.4 2.7 -- -- -- • 5 1.3 44.0 39.6 15.1 -- -- -- 6 2.6 30.8 35.4 22.6 5.1 -- 3.6 __ 7 7.1 41.8 32.1 10.2 5.1 -- 3.6 -- 8 4.9 19.5 46.8 21.5 7.3 -- M __ 9 5.8 44.7 33.5 5.8 7.3 2.9 -- __ 10 11.9 28.5 37.7 16.7 5.2 -- • • 11 5.7 30.0 30.4 17.6 13.2 2.6 -- • 12 2.1 34.6 39.0 22.5 2.2 • -- • 13 4.7 15.4 43.8 24.0 4.3 7.7 -- • 14 11.8 31.1 46.6 9,4 1.2 -- -- -- 15 8.7 26.4 41.5 14,0 4.1 3.7 1,4 -- 16 8.4 41.6 28.8 19,2 2.0 -- -- -- 17 8,4 34.3 38.2 19.1 .... 18 4.2 25,5 31.4 18.4 13.6 3.8 1.5 1.7 19 5.0 19.3 32.3 4.4 12.5 6.4 -- -- 20 6.1 6,8 26.4 23.0 15.2 10.2 9.5 2.7 Average a 7.5 33.1 35.6 15.3 5.2 2.1 1.0 0.2 Average b 7.5 31.8 35.1 16.1 6.0 2.2 1.2 0.3 aAverage for the 20 sublects. bAyerage for the 17 Caucasian subjects. are somewhat different. Sites with 1, 2, 3, and 4 fibers occur at 18.2, 40.7, 28.7, and 9.2 per cent frequency, respectively, while groups with 5 or more fibers at 3.3 per cent. This is in slight disagreement with some published results (31), where the group of 3 fibers was found to dominate. The proportion of single fibers is much lower than found earlier (30). Within our panel, no correlation of any significance was found between group size distribution on one hand and age, fiber population density, or site popula- tion density on the other. This is in contradiction to the conclusions of Oberste-Lehn (20, 21), who claimed strong correlations between group distribution and age, al- though on the basis of smaller sample size. In our view, all available studies--including the present one--used too narrow a data base to allow generalized conclusions in this area. Even if strong correlations were obtained from a much larger study, the averages could not be applied to individuals because of the very large variability of the distribu- tion pattern. The relative positions of fibers in groups showed no specific geometric patterns in agreement with earlier findings (28). SIMPLE AND COMPOUND FIBERS It has long been known that 2 or more fibers can emerge from a single follicular open- ing at the epidermal level on some parts of the body, including the scalp. In the litera-
Purchased for the exclusive use of nofirst nolast (unknown)
From: SCC Media Library & Resource Center (library.scconline.org)