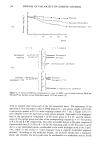
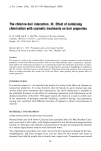
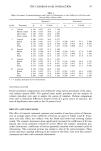
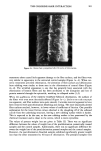
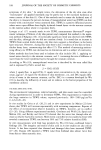
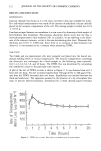
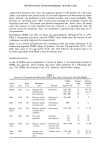
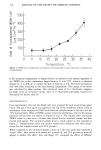
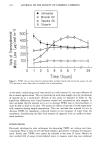
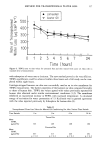
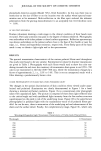
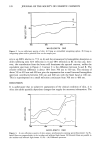
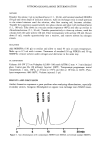
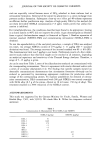
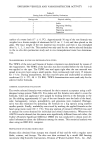
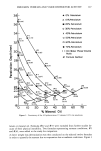
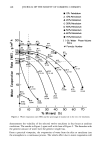
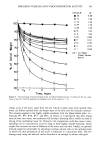
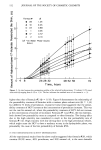
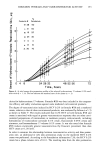
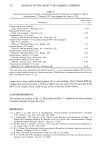
146 JOURNAL OF THE SOCIETY OF COSMETIC CHEMISTS at 45øC, and two months at 35øC. Although formula #8 seemed to have better physical stability after two months at different temperatures, it still started to bleed within three months. Formulas containing 18.9% water were physically stable for at least four months. The physical instability of these formulas was likely due to incomplete emulsi- fication observed during the preparation of these formulas. Formulas containing 28.9% or more water were found to be physically stable for at least four months at all storage temperatures. CONSISTENCY DETERMINATION Most of the emulsions prepared in the study were highly viscous, and their viscosity and yield values were difficult to measure with a conventional viscometer. A penetrometer was used to measure the consistency of the emulsions. The consistency results are plotted in Figure 1. As can be seen, at constant concentration of petrolatum (or mineral oil), the formulas become high-consistency emulsions as the concentration of mineral oil (or petrolatum) is increased. However, regardless of the water concentration, as soon as the total concentration of the oil phase reaches 60% or more, slight decreases in consistency (slight increases in penetration depth) were observed. This phenomenon might be due to insufficient emulsification power, where the unemulsified oil phase acts as a lubricant causing deeper penetration of the plunger. VOLATILITY DETERMINATION Figure 2 represents the data obtained from water evaporation rates determined by an evaporimeter and plotted against the concentration of mineral oil in the formulas. The phase-volume ratio indicated in parentheses also follows the trend in which the water evaporation rate decreases as the phase-volume ratio increases. At a constant concentra- tion of mineral oil, the water evaporation rate decreases inversely with the concentration of petrolatum but is directly proportional to the concentration of water in the formulas. The trend presented in Figure 2 seemed to agree reasonably well with the results of consistency in Figure 1 however, the water evaporation rate decreased continuously even at low water content level (8.9% and 18.9%), whereas the consistency of the same formulas increased slightly. Due to the limited source of excised human skin, a small group of formulas was selected for further evaluation. The selection was based on physicochemical stability results and water evaporation rates which suggest that at least 28.9% water might be needed to achieve complete emulsification and at least 40% oil phase is needed to reduce the water evaporation rate. A "one-factor-at-a-time" technique was adopted for formulation opti- mization. The approach used was to select a center formula (#28) which meets the above two criteria. Two straight lines were drawn perpendicularly across formula #28 as shown in Figure 2 (dotted line). Formulas (#2, # 10, # 17, #23, and #28--desig- nated as group 1) selected from the vertical line, which represents formulations with different phase-volume ratios from 0.19 to 1.34, were studied first to determine the effect of the o/w phase-volume ratio. Secondly, at a fixed 4) (1.34) value, formulas (#6, #13, #19, #24, #31, and #28--designated as group 2) from the horizontal line representing formulations with different petrolatum content, were studied for any ac- tivity increase that could be further enhanced by increasing the concentration of petro-

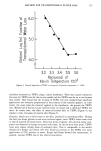
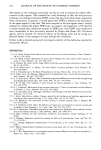
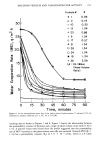
EMULSION VEHICLES AND VASOCONSTRICTOR ACTIVITY 147 • & 0% Petrotetu • /• 10% Petroteturn (0.06) ß 2:0% Petro[eturn 30% PetroLeturn [#9 32' :50 28 26 #2 (0.19) (0,35) #3 (0.35) #tt (0.57) #4 (0.57) 5 O.88) X 40% Petrototum 0 50% Petro[otum [] 60% Petroletum ß 70% Petro[etum ( ) Oi[/Weter Phase-Volume Retio # Formule Number 22 #36 #34 2O t8 0 #18 #t2 (0.88) (0.88) 24 [1.34) #19 #t3 (t.34) •8 (3.59) #7 (3.59) •20 •30 (2.10) •14 (3.59) {z.lo) {2'1ø) I I I I I I t0 20 30 40 50 60 70 % Mineral Oil Figure 1. Consistency of the 36 hydrocortisone 17-valerate 0.2% o/w emulsions. latum or mineral oil. Formulas #32 and #35 were excluded from further studies be- cause of their physical instability. Two formulas representing extreme conditions, # 1 and #36, were added to the study for comparison. A direct weight loss determination was then conducted on the selected twelve formulas in order to quantify the amount due to evaporation loss at ambient conditions. Figure 3
Purchased for the exclusive use of nofirst nolast (unknown)
From: SCC Media Library & Resource Center (library.scconline.org)