IN VITRO INTERACTION OF VEHICLES 253 initial equilibration period (one half hour), the donor was added to the skin sample mounted in the cell. The fraction collector was set to collect effluent for a desired time interval. Each cell was inspected at different time intervals for the presence of air bubbles under the skin surface. Any bubbles formed during the experiment were removed by tilting the cell. Depletion of the donor was avoided by total replacement with fresh donor solution periodically, as necessary, to maintain the concentration as essentially invariant. The experiment was continued until a sufficient number of samples were collected to allow estimation of the steady-state flux (J). At the end of the experiment, receptor samples, unpenetrated donor (plus cell washings), and skin samples were analyzed for caffeine content by liquid scintillation counting. Data analyses. Raw radioactivity counts were converted to quantities of permeant using counting efficiencies and specific activities. Cumulative amounts of permeant penetrated per unit area were plotted against time and the linear portion of each plot was subjected to linear least square regression to determine steady-state flux and lag time (t L) for that penetration experiment. The permeability coefficient (Kp) was calculated by dividing steady-state flux by the donor concentration of penetrant. Caffeine solubility studies. The solubility of caffeine in various solvents was determined by adding an excess amount of nonradiolabeled caffeine to 10 ml of solvent in test tubes. The tubes were kept for one week in a water bath maintained at 32øC and shaken at regular intervals. The solutions were then filtered through 0.45 ptm disposable filters and analyzed spectrophotometrically. Caffeine content was determined using calibration curves of caffeine constructed with the solvents. Statistical analyses. All data were evaluated using analysis of variance (ANOVA). Dif- ferences between means were considered significant if p was less than 0.05. RESULTS AND DISCUSSION Experiments were carried out to determine the effects of receptor fluid flow rate on the permeation of caffeine through hairless mouse skin. The use of a low flow rate may give rise to a large stagnant layer and reduced dermal permeation. Two flow rates, 1.0 and 3.0 ml/hr, were selected, and permeation experiments were carried out using full- thickness dorsal skin and an aqueous caffeine solution as donor. As shown in Table I, steady-state caffeine fluxes obtained at both flow rates were statistically indistinguish- Table I Steady-State Fluxes of Caffeine Through Female Hairless Mouse Skin at Different Receptor Fluid Flow Rates From an Aqueous Donor Solution a'b Flow rate Steady-state flux Animal (ml/hr) (ng/cm2/hr) ! !.0 3.83 (0.35) 3.0 3.83 (0.12) 2 !.0 3.97 (0.25) 3.0 4.10 (0.26) Mean of at least three determinations. Numbers in parentheses are standard deviations.

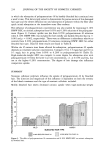
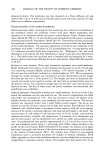
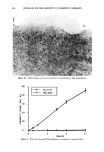
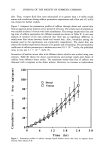
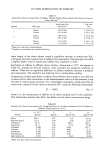
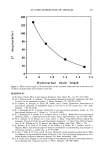
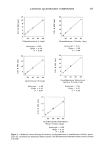
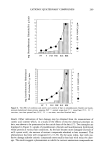
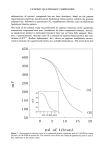
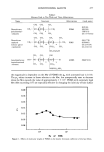
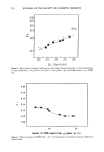
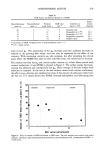
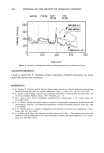
254 JOURNAL OF THE SOCIETY OF COSMETIC CHEMISTS able. Thus, receptor fluid flow rates maintained at or greater than 1.0 ml/hr would ensure sink conditions during caffeine permeation experiments and a flow rate of 2 ml/hr was chosen for further studies. Figure 1 compares the permeation profiles of caffeine through dorsal and ventral skin from an aqueous donor solution over a period of 24 hours. The steady state of permeation was reached at about 14 hours with both membranes. The average steady-state flux and lag time of caffeine permeation for different animals are shown in Table II. A two-way analysis of variance of the data indicated that there was no significant difference in steady-state flux values between dorsal and ventral skin. Also, variability among the animals used in the experiments was statistically insignificant. The dorsal skin was selected for further experiments because of its greater ease of handling. The permeability coefficient of caffeine permeation in hairless mice was 9.8 X 10- 4 cm/hr the published value in rats was 3.1 X 10⁻⁴ cm/hr (5). Interaction of hairless mouse skin with different donor vehicles was studied using nine solvents. Table III shows the donor concentrations and average steady-state fluxes of caffeine from different donor media. The maximum steady-state flux of caffeine was obtained with n-heptane as the donor solvent. However, an increase in hydrocarbon 120 100 80 60 40 • 20 W 0 Dorsal Ventral i i i 0 6 12 18 24 30 Time (hr) Figure 1. Permeation profiles of caffeine through female hairless mouse skin from an aqueous donor solution. Bars indicate S.D.
Purchased for the exclusive use of nofirst nolast (unknown)
From: SCC Media Library & Resource Center (library.scconline.org)