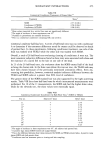
290 JOURNAL OF THE SOCIETY OF COSMETIC CHEMISTS gating the correlation between the results of the methods, they come to the conclusion that "the methylene blue method provides a satisfactory correlation with the image analysis method. It confirms that this simple procedure gives usuable data on the influence of cosmetics on skin roughness." After a reevaluation of the data provided by Schrader et al. (2), the present paper was initially just intended to express some doubts with respect to this conclusion. However, it turned out that a closer look at the data provides, on the one hand, an extended view of certain aspects of the validity and predictive power of both the methylene blue (MB) and image analysis (IA) tests, and, on the other hand, some insight into the general problems of testing skin roughness. RESULTS The data on which this paper is based are taken from Table I in reference 2, and are reproduced here in Table I. The data are normalized mean roughness results and relate to 20 individual values (i.e., to 20 test subjects) for each of 22 skin care products. As described in reference 2, "The 20 individual data sets that were obtained at the begin- ning and the end of each test were normalized. The initial value was set at 100%, so that Table I Data Taken from Table I in Reference 2 for Normalized Mean Skin Roughness Values of 20 Test Persons After Applying 22 Different Skin Care Products and the Ratings of These Products Into Four Classes Methylene blue test Image analysis test Product no. Roughness % Rating Roughness % Rating 1 78.7 + 94.86 2 81.6 + 92.93 3 84.8 + 90.94 4 86.5 q- 93.91 5 88.3 + 95.57 6 88.7 + 95.97 7 90.0 + 94.70 8 90.0 + 97.05 9 94.9 o 97.52 10 98.0 o 92.83 11 98.5 o 92.47 12 98.7 o 97.83 13 100.6 o 95.97 14 103.6 o 97.77 15 104.4 o 102.54 16 105.3 o 102.54 17 105.5 o 97.76 18 109.3 - 98.65 19 110.3 - 102.55 20 113.5 / 57.09 21 114.5 - 94.45 22 122.7 - 95.91

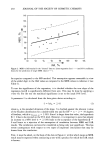
SKIN ROUGHNESS ASSESSMENT 291 the value of use indicates the percentage change the product has achieved for each parameter." Values above 100% indicate increased skin roughness, while values below 100% relate to smoothed skin. The methylene blue roughness (MBR) values are plotted versus those for image analysis roughness (IAR) in Figure 1. This figure shows that there is an outlying point that on the one hand is well contained in the data range for the MB method, but on the other hand is well separated from the range of the IA results. The correlation of the data is negative and not significant. Though the outlying point is contained in the original data of Schrader et al. (2), they leave it out without comment for their regression analysis. Accepting, for the time being, the extreme value as an outlier, a "cleaned" set of data is obtained, summarized in Figure 2, which is equivalent to Figure 1 in reference 2. The parameters for the linear regression line (solid line in Figure 2) are in agreement with reference 2' slope: b = 1.70 (0.705) y-axis intercept: a = - 66.1 (10.27) correlation coefficient: r = 0.484 number of data points: n = 21 The values in brackets are the standard deviations of the parameters. Though the data points relate to 20 individual results and are actually mean roughness values, they will be treated as single values in what follows, since there is no information about, for example, their standard errors. The regression analysis is based on the assumption that the image analysis method provides an independent variable that exhibits an accuracy by 130 120 110 100 •0 80 ß ß ß ß ß ß 70 50 60 70 8'0 9'0 1(50 110 IAR, % Figure 1. Methylene blue roughness (MBR) vs image analysis roughness test results (IAR) for all data in Table I. Linear regression line ( ).
Purchased for the exclusive use of nofirst nolast (unknown)
From: SCC Media Library & Resource Center (library.scconline.org)