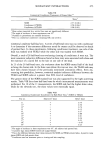
292 JOURNAL OF THE SOCIETY OF COSMETIC CHEMISTS 130 110 90-1 70 •0 i i i i i 90 92 % 96 98 100 102 IAR, % Figure 2. MBR vs IAR results for the "cleaned" data set. Linear regression line ( limits for the prediction of single MBR values (---). ) and 95% confidence far superior compared to the MB method. This assumption appears reasonable in view of the added digit in the IAR values as compared to the MBR values in reference 2 (see Table I). To test the significance of the regression, it is checked whether the true slope of the regression line [3 is significantly different from zero. This may be done by applying a t-test (4). For the test the statistical significance is set to the usual 95% level. A parameter t is calculated from the data given above according to t = b/s b = 2.41 (1) where s b is the standard deviation of the slope. t is checked against the relevant t-value of the Student distribution for a double-sided test and for DF = n - 2 = 19 degrees of freedom, which is t95%(2) ' 19 -- 2. 093. Since t is larger than this value, the hypothesis [3 = 0 has to be rejected on the 95% level. However, it is important to note that already an increase to a 98% level (t = 2. 539) leads to the acceptance of the hypothesis [3 = 0 and hence to a rejection of the assumption of correlation between MBR and IAR results. The correlation can hence be considered as being only just significant. This has severe consequences with respect to two types of important conclusions that may be drawn from the correlation. First, it must be asked, on the basis of the data in Figure 2, within which range an MBR result may be expected when conducting a test with a product for which the IAR result is known.

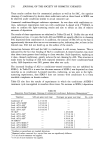
SKIN ROUGHNESS ASSESSMENT 293 Predicting an MBR value, 9i, for a given IAR value, xi, the range within which the MBR result can be expected with 95% probability is given by Zar (4): •i -•- t95%(2),19 Sp, (2) where s[ ] = 2 1 + 1/n + (xi •)2 (3) Syi y'x -- (Xj -- •)2 j=l S2y.x is the residual mean square from analysis of variance, where Sy.x is known as the standard error of regression. n is the total number of IAR data with the individual values x i and the mean i. On the basis of equations 2 and 3, the so-called "confidence bands for single observa- tions" are calculated for the whole range of IAR values. They are given as broken lines in Figure 2. For further discussion, the values for selected products, representing the data range, are summarized in Table II. Accepting for the current argument IA as an objective reference method and the MB method as an indirect but fast and practical method, this will lead to the question within which range (95% confidence limits) the true IAR value can be expected if the MBR value for a product is known from experiments. This question involves a method known as "inverse prediction" (4). Based on the correlation of the IAR and MBR results, the expected IAR value i• can be predicted from an MBR value Yi by i• = (y• - a)/b (4) The related prediction range is given by: • + b(yi- •)/K + t/K (xj - i)2 + K(1 + l/n)] j=l where (5) K = b 2 - t2s2 b (6) and t = t95%(2) ,19 = 2.093. Table II IAR and MBR Values for Selected Cases and the Minimum Values for the 95% Confidence Limits of the Prediction of Single MBR From IAR Values (all values in %) 95% Confidence range for MBR prediction IAR value MBR value MBR value Product no. measured measured predicted min max 3 90.94 84.8 88.5 65.1 112.0 21 94.45 114.5 94.5 72.3 116.7 18 98.65 109.3 101.7 79.4 123.9 15 102.54 104.4 108.3 84.5 132.0
Purchased for the exclusive use of nofirst nolast (unknown)
From: SCC Media Library & Resource Center (library.scconline.org)