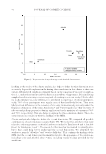
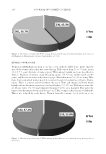
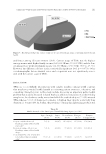
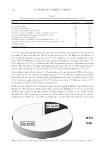
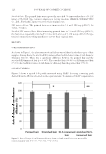
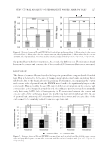
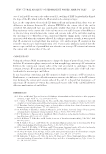
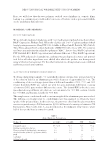
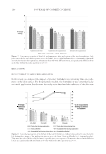
JOURNAL OF COSMETIC SCIENCE 112 60.7% to treat hyperpigmentary disorders where more than one-third of the women were not aware of the potential side effects of these products (19). In Malaysia, prevalence of skin lightening products usage was 60.6% (20). Askari et al. (2012) studied the preva- lence and determinants of using bleaching products in Pakistan. The prevalence was 59% (21). Dlova et al. (2015) evaluated the skin lightening practices of women in South Africa. The prevalence of using skin lightening products was 32.7%. The main reported reasons were treatment of skin problems (66.7%) and skin lightening (33.3%) (22). In accordance with other studies (17), the prevalence of current usage of TPAs in the pres- ent study was 43.3% and that of regular usage was 73.3%, which is slightly greater than rates reported in a previous Saudi study by Alghamdi with a rate of current usage of 38.9 (16). In Jordan, a prevalence rate of 60.7% has been reported (19) whereas it was 67.2% in Senegal (23) and 72.4% in Lagos, Nigeria (24). In the present study, 13.4% of the participated women applied TPAs to their whole body (Figure 3). This fi gure is higher than that reported by Alghamdi (7.3%) in a previous Saudi study conducted among women visiting outpatient clinics in the Saudi capital, Riyadh (16). This increase in rate may be attributed to the women’s desire to achieve a lighter face and body color infl uenced by the concept of beauty linked to fair skin Table V Reasons for Regular Use of Skin Bleaching Agents Among the Participants (n = 389) Reasons Frequency Percentage To increase beauty 177 45.5 To increase self-esteem 147 37.8 To improve appearance among friends 17 4.4 To increase chances of fi nding a spouse (for single) (n = 155) 21 13.5 To secure and stabilize marriage (for married) (n = 198) 19 9.6 To imply descend from high class 8 2.1 To increase chances of fi nding a job (for unemployed) (n = 79) 5 6.3 To stabilize your situation at your current job (for employed) (n = 145) 3 2.1 To follow fashion 11 2.8 To renew their look 141 36.2 Figure 8. Desire to use bleaching creams that give fast results even if its components are unknown (n = 389).

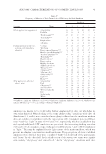
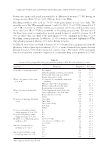
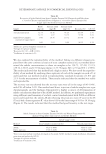
HEALTH KNOWLEDGE AND ATTITUDE REGARDING BLEACHING AGENTS IN WEST SAUDI ARABIA 113 (Table V). However, it is much lower than fi gures reported from Nigeria (81.3%) (8, 24) and Senegal (92%) (9). As expected, the current study revealed that women with higher household incomes were using more bleaching creams than those with lower income (Tables I–II), although not reaching a signifi cant cut-off level. The participants in this study spent on the an average of 136.4 ± 217.3 SR (34.1 ± 54.1 USD) monthly on TPAs (Table II), which was considered relatively high keeping in mind that the household income of 45.4% of the participants was below 5,000 SR (1,250 USD) (Table I). Unexpectedly, in the present study, higher educated women (who should be more knowl- edgeable of TPAs’ side effects) used these products more signifi cantly. Similarly, the highest rate of usage unexpectedly was reported in the age group 26–40 years as it was expected to be higher in younger ages (Table I). This may be attributed to the idea that fair skin is not only a symbol of beauty but is also associated with better employment and marital pros- pects. A previous study carried out in Southern Nigeria reported that TPAs-related side effects were particularly frequent in unmarried women, literate women, and female students (24). Importantly, skin TPAs are harmful to health at a level that is comparable with or even exceeds the level of other risk behaviors (14). Despite that, the lack of knowledge of the danger of bleaching products is evident in this study, e.g. mercury is the most dangerous constituent of bleaching products as it is highly toxic. This is known by only 30.2% of Table VI Sociodemographic Factors Associated with Current Usage of Bleaching Agents Age Current use of bleaching agents χ2 p value Yes N = 230 No N = 301 Age (years) 16–25 (n = 176) 74 (42.0) 102 (58.0) 26–40 (n = 288) 144 (50.0) 144 (50.0) 40 (n = 67) 12 (17.9) 55 (82.1) 22.97 0.001 Marital status Single (n = 210) 83 (39.5) 127 (60.5) Married (n = 267) 121 (45.3) 146 (54.7) Divorced/separated (n = 39) 21 (53.8) 18 (46.2) Widowed (n = 15) 5 (33.3) 10 (66.7) 4.04 0.258 Educational level (n = 515) Illiterate (n = 25) 5 (20.0) 20 (80.0) High school or lower (n = 184) 71 (38.6) 113 (61.4) University or higher (n = 306 147 (48.0) 159 (52.0) 9.99 0.007 Occupation House wife (n = 168) 68 (40.5) 100 (59.5) Student (n = 65) 29 (44.6) 36 (55.4) Employed (n = 185) 85 (45.9) 100 (54.1) Unemployed (n = 113) 48 (42.5) 65 (57.5) 1.15 0.765 Monthly average household income in SR 2,000 ( 500 USD) (n = 88) 2,000–5,000 (500–1,250 USD) (n = 153) 26 (29.5) 62 (70.5) 5,001–10,000 (1,250–2,500 USD) (n = 151) 71 (46.4) 82 (53.6) 10,001–20,000 (2,500–5,000 USD) (n = 107) 70 (46.4 81 (53.6) 20,000 ( 5,000 USD) (n = 32) 47 (43.9) 60 (56.1) 16 (50.0) 16 (50.0) 8.56 0.073
Purchased for the exclusive use of nofirst nolast (unknown)
From: SCC Media Library & Resource Center (library.scconline.org)