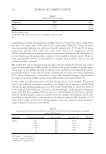
JOURNAL OF COSMETIC SCIENCE 134 CLINICAL STUDY PROTOCOL Thirty two healthy female subjects were recruited for this study. They were 35–65 years old, were graded with a score of 2–4 on the Skin Aging Atlas (16) for crow’s feet wrinkles, and considered themselves to have a loss of elasticity in the skin. The study started on July 20, 2015 and concluded on July 24, 2015. All subjects executed an Informed Con- sent Form before the study started. The principles of Good Clinical Practice, as defi ned by the International Conference on Harmonisation of Technical Requirements for Registration of Pharmaceuticals for Human Use, were followed except for the requirement that investigational products should be manufactured, handled, and stored in accordance with applicable Good Manufacturing Practice, which is not a requirement for cosmetic products. The study protocol was reviewed and approved by our Institutional Review Board on June 18, 2015. There were no adverse events encountered and no protocol amendments or deviations took place. About 0.4 g of each test product was applied evenly to the left or right side of the face in a randomized manner. The test was double blind and subjects served as their own refer- ence. Four test products were applied over the 2 day duration of the study. For 3 days before the study, subjects cleansed the face twice a day with PURPOSE® Gentle Cleansing Wash (Valeant Consumer Products, Montreal, Canada). On study days, subjects acclimated for 20 min, after which facial images were recorded and skin mechanical measurements were taken. Two test products were applied in a split-face fashion after the baseline measure- ments, after which additional images and mechanical measurements were taken. MECHANICAL MEASUREMENTS The mechanical properties of skin were assessed using a Ballistometer (Dia-stron, Broomall, PA) and a Cutometer® SEM 575 (Courage & Khazaka, Cologne, Germany). The Ballis- tometer determines skin elasticity by monitoring the bouncing of a stylus on the skin surface. The Cutometer measures the deformation of skin produced by suction for a brief time period (17). Although the elasticity measurement principle is different, the two instruments often show the same trends. The Cutometer generates a range of mechanical properties that relate to skin elasticity, deformation under stress, and recovery. We have focused on the R0 and R3 parameters, which relate to the maximum amplitude of deformation of the skin initially and after three cycles of deformation and recovery, respectively, indicating skin fi rmness after repeated deformation (18). In both cases, lower values of the parameters indicate less viscous de- formation and therefore fi rmer, more elastic skin. The Ballistometer measures the coeffi cient of restitution (CoR), which is based on the stylus bounce height relative to the starting height, a measure of the skin elasticity. Higher values indicate the skin is more elastic and fi rmer (19). Hence, if skin becomes fi rmer over the course of the study, we expect R0 and R3 to decline and the CoR to increase. Cutometer measurements were taken on the left and right cheekbones with four curves recorded on each area for each subject and an average calculated. Ballistometer data were obtained on the left and right temples, with three measurements taken at each location and an average calculated.

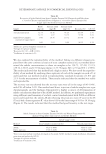
REDUCING FACIAL WRINKLE SIZE USING POLYMERS 135 SKIN IMAGING METHODS Facial images of the subjects were obtained with a VISIA-CR 2D facial imaging system (Canfi eld Scientifi c, Fairfi eld, NJ) and with an AEVA-HE 3D Imaging System (Eotech SA, Marcoussis, France). The VISIA records and automatically analyzes left, right, and frontal facial views, but does not capture depth information on facial features such as pores and wrinkles. VISIA-CR 2D images were taken as full face images with front, left, and right views. The AEVA-HE 3D system uses fringe projection and cameras to analyze the topography of the skin surface, including wrinkles and other surface features. The skin roughness is calculated as two parameters, the arithmetic mean of the surface roughness, Sa, and the root mean square of the surface roughness, Sq. Additional parameters used by the AEVA system are the curvature area and density, defi ned as the area of all features that have a cer- tain set curvature and the ratio of that area to the total area, respectively. We used a curvature set point of 0.5–1.0 mm, which corresponds to fi ne lines in the skin. The higher values of curvature area or density suggest more visibility of the fi ne lines. Finally, AEVA also reports total detected wrinkle area and volume, which are determined by the instrument software. AEVA images were recorded as full face images with 160 mm focal length lenses. The zones for analysis were the cheek and crow’s feet areas. CONSUMER PERCEPTION Subjects’ perception of product performance and acceptance was evaluated through self- administered questionnaires, using an internet-based survey administrator (SurveyMonkey). The subjects completed the questionnaires individually without any extrinsic infl uences such as other volunteers or the results of technical measurements. The consumer percep- tion questionnaires instructed subjects to consider the entire half face to which they had applied product when completing the questionnaire. STATISTICAL ANALYSIS For the clinical instrument data, we computed the descriptive statistics (means, standard deviation, and standard errors of the mean (SEM) of each parameter and the change of each parameter before and after product application. The percentage change from baseline was calculated by subtracting each subject’s baseline parameter value from the value after product application. Statistical analysis of the change in the parameters was conducted with Minitab® software (Minitab, Inc., State College, PA). The normality of the data distribution was confi rmed with the Kolmogorov–Smirnov test and the equality of variances was confi rmed with a Levene’s test. Once normality and equal variance were confi rmed, a paired t-test was conducted to compare the parameters before and after product application. In addition, a one-way analysis of variance (ANOVA) followed by Tukey’s test was conducted to compare the before and after application change of each parameter for the four different treatment products at 95% confi dence level (p-value 0.05). The consumer perception data were analyzed with Minitab® software as well. Perfor- mance parameters were evaluated through the use of a 6-point scale (1 = not at all 2 = slightly 3 = somewhat 4 = moderately 5 = very and 6 = extremely). A 5-point scale
Purchased for the exclusive use of nofirst nolast (unknown)
From: SCC Media Library & Resource Center (library.scconline.org)