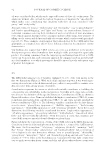
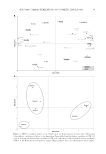
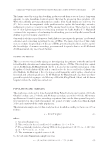
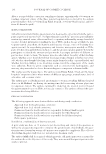
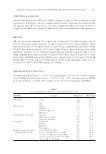
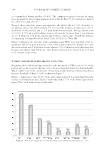
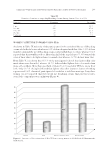
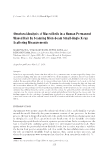
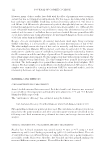
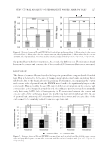
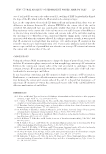
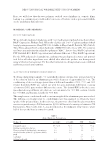
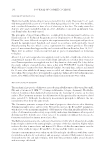
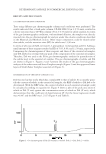
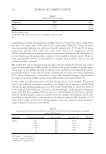
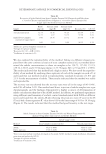
JOURNAL OF COSMETIC SCIENCE 136 (1 = slightly 2 = somewhat 3 = moderately 4 = very and 5 = extremely) was employed to evaluate the perception of reduction in wrinkle visibility. To determine differences in the perception ratings among the test products, a one-way ANOVA at a 95% confi dence level ( p-value 0.05) was performed for each parameter followed by a Tukey comparisons test. Again, the normal distribution and equality of variances were confi rmed for each parameter through a Kolmogorov–Smirnov test and a Levene’s test, respectively, before the ANOVA. RESULTS POLYMER GLASS TRANSITION MEASUREMENTS The polymers investigated differ markedly in their response to environmental humidity (Figure 1). The PVP absorbs over 50% water at 90% relative humidity, leading to a decline in glass transition temperature to below freezing. The dependence of Tg on polymer con- tent confi rms the pattern measured by Buera et al. (14). On the other hand, the AMC absorbs much less water even at 90% relative humidity and its decline in Tg is much less steep. Signifi cantly, the Tg is near room temperature at high water levels. This indicates that at room temperature the glass transition of AMC solutions is reached after evapora- tion of a relatively small amount of water compared with PVP. MECHANICAL PROPERTIES OF THE SKIN Treatment of the facial skin with the polymer formulations made skin fi rmer in both Cutom- eter and Ballistometer measurements. All polymers increased fi rmness signifi cantly over baseline as measured by Cutometer parameters R0 and R3 (Figure 2). Moreover, the 4% AMC formulation increased skin fi rmness signifi cantly more than the placebo. There was no signifi cant difference in skin tightening between the 4% AMC, 2% AMC, and PVP formulations, nor was there a signifi cant difference between the 2% AMC, PVP, and placebo formulations. Fig ure 1. Glass transition temperature and water absorption of solid polymer material exposed to different levels of relative humidity.

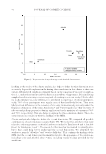
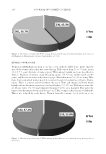
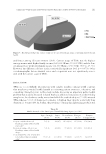
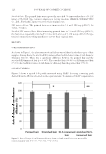
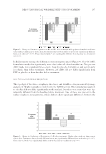
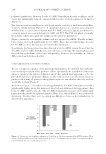
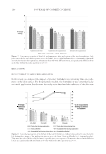
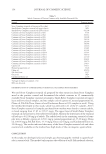
REDUCING FACIAL WRINKLE SIZE USING POLYMERS 137 In Ballistometer testing, the differences were more pronounced (Figure 3). The 4% AMC formulation made skin signifi cantly more elastic than all other formulations. Two percent AMC made skin signifi cantly less elastic than the placebo formulation and signifi cantly less elastic than before treatment. However, 2% AMC did not differ signifi cantly from PVP or placebo or from baseline before treatment. SKIN TOPOLOGY BY FRINGE PROJECTION The topology of the skin—roughness, fi ne lines, and wrinkles—was measured by image analysis of 3D photographs recorded with the AEVA system. The formulations applied to the skin did not differ signifi cantly in this analysis, but there were some that were sig- nifi cantly different from the baseline before treatment. One of these was present in the surface roughness measurements, which did not show signifi cant differences between the Figu re 2. Change in Cutometer parameters R0 and R3 after treatment with polymer formulations. Lower values indicate fi rmer, more elastic skin. Treatments denoted with different letters are signifi cantly different from each other (p 0.05). Those denoted with * are signifi cantly different from baseline (no treatment) (p 0.05). Figure 3. Change in Coeffi cient of Restitution (CoR) after treatment. Higher values indicate fi rmer, more elastic skin. Treatments denoted with different letters are signifi cantly different from each other (p 0.05). Those denoted with * are signifi cantly different from baseline (no treatment) (p 0.05).
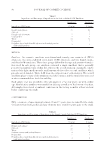
Purchased for the exclusive use of nofirst nolast (unknown)
From: SCC Media Library & Resource Center (library.scconline.org)