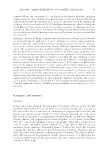
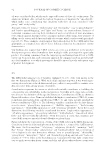
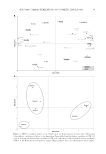
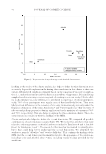
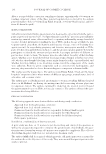
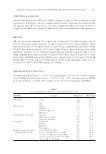
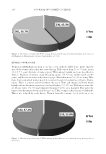
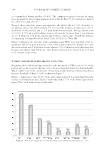
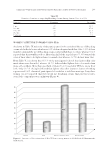
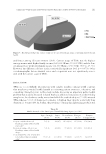
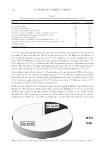
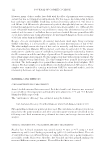
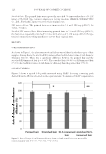
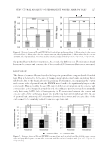
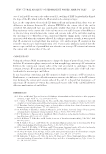
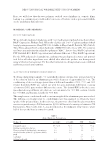
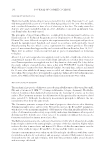
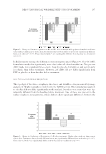
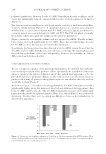
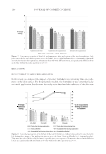
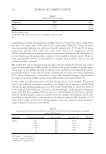
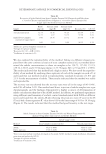
JOURNAL OF COSMETIC SCIENCE 138 polymer formulations. However, for the 4% AMC formulation the skin roughness on the cheek was signifi cantly reduced compared with baseline, for both parameters Sa and Sq (Figure 4). The skin curvature area and density, which indicate the visibility of fi ne lines and wrinkles, showed a similar pattern (Figure 5). A signifi cant decrease in curvature area compared with baseline occurred after treatment with 4% AMC, whereas a signifi cant decrease in curvature density was seen with both 2% AMC and PVP. The PVP and placebo formula- tions did not show any signifi cant changes in the curvature parameters. Figure 6 shows the total wrinkle volume and area reported by AEVA. Wrinkle volume, but not area, decreased signifi cantly for 2% AMC. There was a relatively large decrease for 4% AMC as well, but this was not statistically signifi cant. In summary, the fringe projection data obtained with the AEVA system showed that the 4% AMC and 2% AMC formulations were effective in reducing the skin roughness and the visibility and volume of fi ne lines and wrinkles. However, the formulations did not differ signifi cantly from each other. CONSUMER PERCEPTION OF PRODUCT EFFECTS To test consumer acceptance of the prototype formulations, we surveyed the study sub- jects on their perception of the products’ effects. Specifi cally, we intended to learn if the subjects experienced a tightened skin feel and if they judged their appearance to be im- proved after product application (Figure 7). The subjects were also asked how tacky the products felt during all phases in the application process and whether the tacky feel was acceptable to them (Figure 8). As shown in Figure 7, the subjects on average found the 4% AMC formulation to yield a signifi cantly higher rating for tightened skin feel and tightened skin appearance than both 2% AMC and the placebo. The 2% AMC formulation was also rated signifi cantly higher than the placebo for tightened skin feel. None of the other differences were statistically signifi cant. Notably, there were no signifi cant differences between the formulations on smooth skin appearance. Figure 4. Change in skin roughness parameters Sa and Sq on cheek area measured by AEVA analysis. There are no signifi cant differences between treatments (p 0.05). Treatments denoted with * are signifi cantly dif- ferent from baseline (no treatment) (p 0.05).

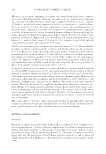
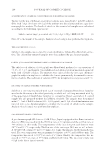
REDUCING FACIAL WRINKLE SIZE USING POLYMERS 139 The data in Figure 8 shows that the formulations which produced a tightening sensation were also the most tacky. Four percent AMC was rated signifi cantly higher than the benchmark and the placebo for tacky feel during application, tacky feel during drying time, and tacky feel after drying. The 2% AMC formulation was also rated signifi cantly higher than the benchmark and placebo for tacky feel during drying time. However, although these formulations were rated higher for tackiness, consumer accep- tance was still high. With the exception of 4% AMC during application, a signifi cant majority (p 0.05, 75% or more of respondents) found the tacky feel of the products to be acceptable. Figure 5. Ch ange in skin curvature area and curvature density on the cheek area measured by AEVA analy- sis. A decline in curvature indicates lower visibility of fi ne lines. There are no signifi cant differences between treatments ( p 0.05). Treatments denoted with * are signifi cantly different from baseline (no treatment) ( p 0.05). Figure 6. Chan ge in wrinkle topography as reported by the AEVA software as total detected wrinkle area and volume. Treatments denoted with * are signifi cantly different from baseline (no treatment) (p 0.05). The data show that total wrinkle volume decreased signifi cantly for skin treated with the 2% AMC formula- tion. There are no signifi cant differences between treatments (p 0.05).
Purchased for the exclusive use of nofirst nolast (unknown)
From: SCC Media Library & Resource Center (library.scconline.org)