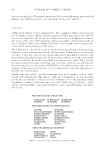
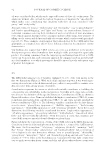
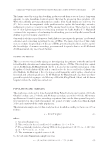
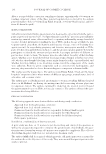
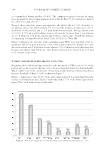
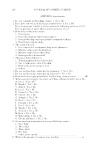
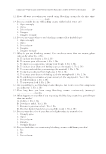
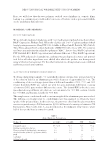
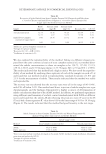
JOURNAL OF COSMETIC SCIENCE 88 survey for each product. Testing was administered in a research laboratory under artifi cial daylight type of illumination at room temperature (between 22° and 24°C). CATA SURVEY CATA surveys (Figure 1) were administered to have consumers evaluate sensory proper- ties of emulsions before, during, and after application. First, participants were asked to look at each emulsion in the jar and check characteristics they felt appropriate from the fi rst section of the survey. Then they had to apply each sample to the forearm and fi ll out the second part of the survey. Finally, they had to test the application site again after 3 min and fi ll out the third part of the survey. The CATA survey consisted of a list of 30 words/word groups divided into three groups (i) the fi rst section (six terms) was related to the appearance of the products (ii) the second section (16 terms) was related to the sensory characteristics and skin feel (rub-out, pick- up, and immediate skin feel) provided by the products and (iii) the third section (eight terms) was related to the afterfeel provided by the products after 3 min. When creating the survey and selecting terms, the terminology and words used in the consumer behavior descriptive analysis described in the ASTM E1490-11 guidelines were taken into con- sideration. Participants were asked to select as many words as they felt appropriate to describe each of the products. Similar terms that can be considered synonyms were listed together, such as “thick/ creamy” and “silky/smooth.” The purpose of this type of listing was to decrease the num- ber of terms used and also to make it easier for consumers to select the appropriate terms. In addition, a number of antonym terms were in the CATA survey, for instance, “thick/ creamy” and “thin/milky,” “easy to spread/slippery,” “hard to spread/dragging,” and “light” and “heavy.” Figur e 1. Questions of the CATA survey used in this study.

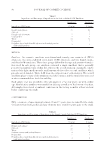
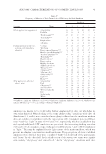
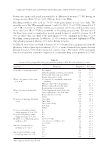
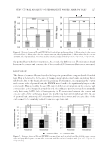
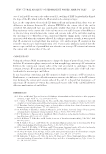
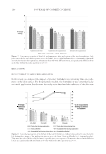
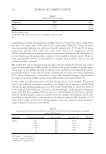
SENSORY CHARACTERIZATION OF COSMETIC EMULSIONS 89 PHYSICAL EVALUATION OF THE EMULSIONS A Discovery Hybrid Rheometer DHR-3 (TA Instruments, New Castle, DE) was used for measuring rheological properties of the different emulsions. A 40-mm 2° cone and plate geometry at 25.0° ± 0.1°C tested samples of 0.8 ml. Steady state viscosity was recorded at various shear rates (Table IV). DATA ANALYSIS Frequencies of mention for each term were determined by counting the number of par- ticipants that used a term to describe each emulsion. The Skillings–Mack test, which is the general form of the Friedman test (23), was implemented in STATA (StataCorp LLC, College Station, TX) for each term (within-subjects variable), considering samples (dependent variable) as the sources of variation to evaluate whether the CATA survey was able to detect differences in consumers’ perception of the evaluated cosmetic emulsions. The robustness of the Skilling–Mack test was evaluated with a Cochran’s Q test (24). Hierarchical cluster analysis (HCA) was carried out on the CATA survey to identify groups of emulsions that shared similar preferences based on consumers’ opinions (25). A multiple factor analysis (MFA) was performed on the frequency table containing re- sponses to the CATA survey to investigate the relationship between the six emulsions and the 30 terms used in the CATA survey (26). All factorial analyses were performed using R language (R Core Team, 2013). Emulsions were compared in pairs using a two-sample analysis of variance (ANOVA) test. RESULTS AND DISCUSSION VISCOSITY MEASUREMENTS The viscosity of each emulsion is reported at a single shear rate (1 s-1) and varied more than 10-fold (Table IV). Emulsions 1 and 2 contained cetyl alcohol as a co-emulsifi er. Because of the waxy nature of cetyl alcohol, this component also acted as a thickener, in- creasing the viscosity of the emulsions. Emulsions 3 and 4 contained a combination of sorbitan stearate and sorbityl laurate, an off-white, fl aky ingredient that produced emul- sions with a self-bodying effect (27). Emulsions 5 and 6 contained two liquid emulsifi ers, which did not add to the viscosity of the emulsion. Table IV Viscosity of Each Emulsion at 1 s-1 Sample Viscosity (mPa·s) Emulsion 1 17,500 Emulsion 2 17,500 Emulsion 3 6,100 Emulsion 4 8,000 Emulsion 5 1,200 Emulsion 6 1,800
Purchased for the exclusive use of nofirst nolast (unknown)
From: SCC Media Library & Resource Center (library.scconline.org)