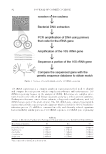
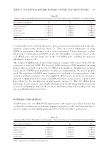
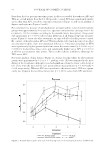
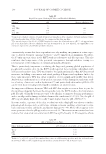
EFFECT OF NATURAL ANTIMICROBIALS ON THE SKIN MICROBIOME 83 is commonly used to identify diversities in bacterial microorganisms and study phy- logenetic relationships between them (7). There are several advantages of using rRNA in molecular techniques such as gene sequencing. These advantages include the presence of ribosomes and rRNA in all cells, the highly conservative nature of the 16S rRNA gene, and the large size of the 16S rRNA gene, enabling its usage for informatics purposes (8). The analysis of rRNA genes begins with isolating a sample of bacteria, followed by the extraction of bacterial DNA. The bacterial DNA undergoes PCR amplifi cation using primers that specifi cally code for the 16S rRNA gene fragment. Amplifi cation produces a population of rRNA gene fragments of equal size, determined by the specifi c primers used. The population of rRNA gene fragments is considered to be representative of the natural microbial population (8). The amplifi ed rRNA genes are then cloned and se- quenced. Comparison of the sequenced rRNA with those in the genetic sequence data- base allows for the identifi cation of phylogenetic groups (9). The 16S rRNA–based taxonomic characterization can provide information on the microbial population present in a given environment and how their relative distribution may differentially evolve un- der an applied treatment over time. MATERIALS AND METHODS A DNA extraction, 16S rRNA PCR amplifi cation, and sequencing study of the skin was conducted to evaluate the microbiome population present on the facial skin and the re- spective changes in microbial populations after 2 weeks of product applications. Table III Changes in Microbiome Population for Participant 2 Treated with Leuconostoc Radish Root Ferment Filtrate Microbiome population T0 T2 T3 Propionibacterium 7.14E+03 8.04E+03 6.57E+03 Staphylococcus 1.05E+03 1.20E+01 2.44E+02 Aerobacillus 5.50E+01 3.00E+00 3.30E+01 Corynebacterium 3.40E+01 3.13E+02 5.10E+01 Streptococcus 1.64E+02 8.10E+01 1.60E+01 Values expressed in cfu/mL at each timepoint. Table IV Changes in Microbiome Population for Participant 3 Treated with Leuconostoc Radish Root Ferment Filtrate Microbiome population T0 T2 T3 Propionibacterium 5.46E+03 2.43E+03 5.98E+03 Staphylococcus 8.02E+02 3.70E+01 2.35E+03 Aerobacillus 8.40E+01 3.20E+01 1.05E+02 Corynebacterium 7.03E+02 1.15E+02 5.44E+02 Streptococcus 1.10E+01 9.00E+00 4.00E+00 Values expressed in cfu/mL at each timepoint.

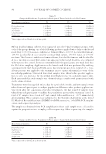
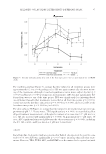
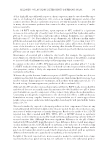
JOURNAL OF COSMETIC SCIENCE 84 Fifteen healthy human subjects were separated into fi ve blind treatment groups, with each of the groups having one of the following products applied twice daily to the lateral nasal folds: 100.0% Leuconostoc radish root ferment fi ltrate, 100.0% Lactobacillus ferment, 100.0% Lactobacillus & Cocos nucifera (coconut) fruit extract, 100.0% water, or 100.0% triclosan. The Leuconostoc radish root ferment fi ltrate, Lactobacillus ferment, and Lactobacillus & Cocos nucifera (coconut) fruit extract are aqueous products and, therefore, are compared with water as the control. It was recommended that the participants not wash their face for 8 h before sampling. Application to the lateral nasal folds was performed by rubbing a premoistened swab back and forth across the treatment area for a total of 60 s. Con- sistent pressure was applied to the treatment area to ensure substantial recovery of the microbial population. Untreated skin swab samples were taken before product applica- tion to serve as a reference for the normal microbial presence on each participant’s skin. Each untreated skin swab sample was obtained using a sterile swab premoistened with sterile saline solution. Treatments were then applied twice a day for a period of 2 weeks, and new samples were taken from each participant to analyze population differences after product applications. One week after the conclusion of product treatments, the last round of samples were taken from each participant to analyze the populations present after treatment ceased. A total of 45 samples were stored in 15 mL conical tubes and frozen at -20°C immediately after sampling. These samples were submitted to the Genomics Laboratory at the David H. Murdock Research Institute (DHMRI) for DNA extraction, 16S rRNA PCR amplifi - cation, and sequencing analysis. The amplicons obtained from PCR amplifi cation from each sample were collected in equimolar proportions into a single pool for sequencing. After sequencing, the samples Table V Changes in Microbiome Population for Participant 4 Treated with Lactobacillus Ferment Microbiome population T0 T2 T3 Propionibacterium 3.03E+05 3.40E+03 1.12E+04 Staphylococcus 5.80E+04 5.69E+02 2.98E+03 Aerobacillus 6.76E+03 6.40E+01 1.85E+02 Corynebacterium 6.24E+03 7.63E+02 4.76E+02 Streptococcus 3.06E+02 4.20E+01 4.20E+01 Values expressed in cfu/mL at each timepoint. Table VI Changes in Microbiome Population for Participant 6 Treated with Lactobacillus Ferment Microbiome population T0 T2 T3 Propionibacterium 5.28E+03 5.32E+03 3.11E+03 Staphylococcus 5.41E+02 4.04E+02 1.94E+02 Aerobacillus 6.20E+01 9.00E+01 6.40E+01 Corynebacterium 8.19E+02 5.87E+02 3.76E+02 Streptococcus 1.20E+03 1.54E+03 1.09E+03 Values expressed in cfu/mL at each timepoint.
Purchased for the exclusive use of nofirst nolast (unknown)
From: SCC Media Library & Resource Center (library.scconline.org)