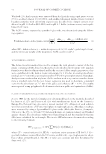
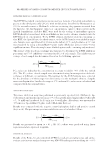
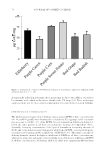
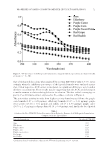
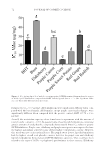
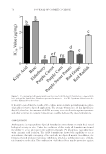
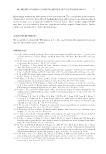
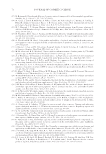
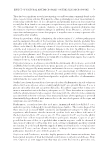
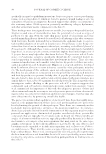
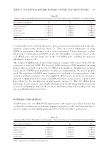
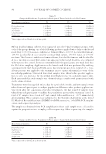
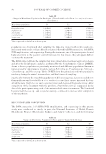
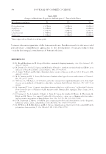
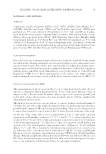
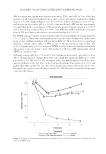
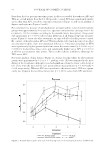
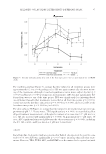
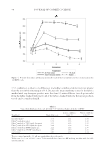
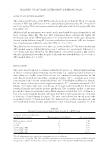
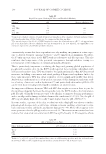
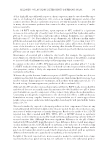
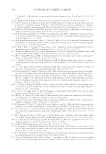
MILDNESS OF LAUNDRY DETERGENTS DIFFERING IN pH 97 For erythema grading (Figure 3), average baseline values for all treatment groups were approximately 0.2 (on a 0–4 grading scale). SLS was again numerically the most irritat- ing of the treatments, although it reached signifi cance versus water only at the fi rst (p = 0.0019) and last (p = 0.049) postexposure measurements. AFC was not signifi cantly dif- ferent from water at any of the time points. TFG was signifi cantly less irritating (based on erythema) than all other treatments: versus SLS at all four time points (p 0.0001), versus water at the last three time points (p = 0.0004 to p 0.003), and versus AFC at the last three time points (p 0.0001 to p = 0.0009). For skin surface pH (Figure 4), average baseline values for all treatment groups were ap- proximately pH 5.5. Versus water, TFG signifi cantly (p 0.0001) increased skin pH at all posttreatment measurements, although the numerical increase was 0.25 pH units or less. SLS also increased pH signifi cantly (p 0.0001) by approximately 0.5 pH units. Of note, AFC signifi cantly increased pH versus the other treatments (p 0.0001), including the 1% SLS control, and by as much as 1 pH unit versus water. 21DCIT Data from this 21-d patch study are presented in Table I. As expected, the positive con- trol (0.05% w/v SLS) was signifi cantly (p 0.05) more irritating than all other treat- ments. However, TFG, TPFG, AFC, and AFCMP were determined to be equivalent (with Figure 3. Forea rm erythema grades after each of the four exposures to the test materials in the 1-d RIFT study.

JOURNAL OF COSMETIC SCIENCE 98 95% confi dence) as their score differences (including confi dence limits) were not greater than the non-inferiority margin of 0.4. Because the mean erythema scores for the fabrics washed with any detergent product were less than 0.3 units different (on a 4-point scale) from the fabric washed with water, all of the fabrics washed with the detergent products tested can be considered mild. Figure 4. Forear m skin surface pH measurements after each of the four exposures to the test materials in the 1-d RIFT study. Table I Upper Ar m Erythema Scores (21 D) with 95% Confi dence Limits from the 21DCIT Treatment Mean skin score Lower confi dence limit 95 Upper confi dence limit 95 Distilled watera 1.60 1.41 1.78 Fabricb washed in water 0.94 0.76 1.13 Fabricb washed in TFG liquid detergent 1.11 0.93 1.29 Fabricb washed in AFC liquid detergent 1.08 0.90 1.26 Fabricb washed in TPFG laundry pac 1.21 1.02 1.39 Fabricb washed in AFCMP laundry pac 1.07 0.89 1.25 0.05% SLSa 1.95 1.77 2.14 a For the control materials, 0.3 mL was applied directly to the patch. b Fabrics are 2 × 2 cm2 of 100% cotton T-shirt washed three times in a HE washing machine with the indi- cated treatment.
Purchased for the exclusive use of nofirst nolast (unknown)
From: SCC Media Library & Resource Center (library.scconline.org)