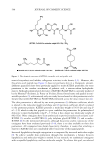
501 INFLUENCE OF MENSTRUAL CYCLE The total fragrance consisted of 116 components in which the major constituents were: γ-methyl ionone (1.5%), 16-oxacyclohexadecan-1-one (Thibetolide® [Firmenich, Geneva, Switzerland], 2.6%), linalool (3.5%), linalyl acetate (4.4%), 1,4-dioxacycloheptadecane-5,17- dione (8.8%), 7-acetyl-1,2,3,4,5,6,7,8-octahydro-1,1,6,7-tetramethyl naphthalene (14.2%, Iso E Super® [International Flavors & Fragrances, New York, NY] major component) and methyl dihydrojasmonate (21.7%, Hedione® [Firmenich, Geneva, Switzerland] main component). INVESTIGATION CENTER The experiment was conducted at a research institute located in São Paulo, Brazil. ETHICAL ASPECTS The study protocol was previously approved by the ethics committee of the University of São Paulo, and was in accordance with Brazilian legislation, norms of International Conference Harmonization, Good Clinical Practice, and the Helsinki declaration. All participants signed informed consent terms before participating in the study. PARTICIPANTS’ VISITS Twenty-nine female volunteers aged between 18 and 40 years old with regular menses (28–30 d) participated in the study. They did not use oral contraceptives for at least 6 mo before the study and fulfilled all inclusion and noninclusion criteria described in the ethics committee approved protocol. Each female participant went to the institute for four visits according to the menstrual cycle phases. On the first visit (D1), ovulatory phase was detected using a noninvasive method through vaginal secretion smear to assess the format of oxalate crystals (5). Then, the investigational product was applied on the skin on a marked study site on the volar forearm during the morning period. After that, we collected headspace of the emitted volatiles on the study site at the following times: initial (immediately after product application), 1 h 30 min, 3 h, 4 h 30 min, and 6 h after product application (respectively t 0 , t 1h30min , t 3h , t 4h30min , and t 6h ). We repeated this procedure on each visit (D2, D3, and D4) to assess all four phases of the menstrual cycle. CHEMICAL ANALYSIS We submitted the volatiles collected from the volunteers to composition determination by the dynamic headspace technique according to the methodology described by Baydar, Mcgee, and Purzicky (1995). This technique quantifies the individual partition of the components of skin fragrance in the air and translates the information for an “olfactory perception profile” (18,19). We applied 40 µL of the investigational product on the defined test site on the volunteers’ forearm. Then, we added ethanol with a microsyringe to allow the fragrance to dry faster.

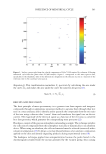
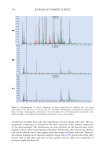
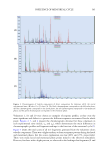
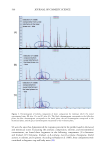
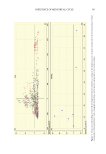
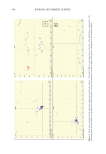
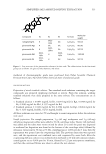
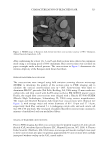
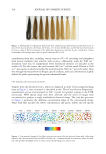
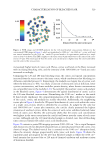
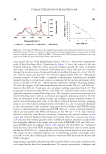
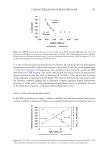
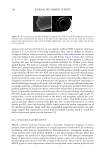
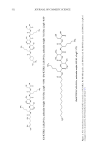
502 JOURNAL OF COSMETIC SCIENCE The treated area was sealed with a glass apparatus to collect volatiles on the experimental times (t 0 , t 1h30 , t 3h , t 4h30 and t 6h ). The volatiles were collected in a glass tube packed with a porous polymer resin based on 2.6-diphenylene oxide (Tenax®) using the dynamic headspace collection technique. After collection, the Tenax® tubes were coupled to a thermal desorption apparatus (ATD 650® Turbo Matrix [PerkinElmer, Waltham, MA]), desorbed at 100°C for 10 min with a helium flow of 60 mL/min and injected in the GC/MS equipment (Agilent model 6890/ Mass Spectrometer 5973). The chromatographic conditions were: • Temperature trap −30°C during the concentration, valve maintained at 150°C. • During the desorption step of the trap, the trap temperature increased to 225°C with a helium flow at 1.5 mL/min. • Injection split ratio 5:1 (total sample injected = 16.7%) interface temperature of 280°C. • Volatiles were transferred to a capillary column HP Ultra 2, 50 m x 0.20 mm i.d. x 0.33- μm film thickness. • Temperature gradient: 50°C/2 min for stabilization followed by a temperature increase of 3°C/min until 280°C. • Carrier gas: helium at a flow rate of 1.5 mL/min. • Mass spectra were registered after the column with an interface at 280°C and ion source temperature of 250°C. • The ionization potential was adjusted to 70 eV and ions monitored with a range of 35–350 mass-charge (m/z). We identified the compound by comparing retention indexes (Kóvats Index—determined relative to the retention times of a series of n-alkanes) and mass spectra with literature data (5,19,20). MULTIVARIATE ANALYSIS OF CHROMATOGRAPHIC DATA The methodology applied in this experiment was adapted from a study previously described by Pavon et al. (2006) for oil samples. The basic principle of mass spectrometry consists of generating ions from compounds, organic or inorganic, through an appropriate ionization method, separating them through their m/z ratio in a mass analyzer, and qualitatively and/or quantitatively detecting the compounds from the ions’ m/z ratio and their respective abundances by means of a detector. The detector “counts” the ions and transforms the signal into an electric current versus retention time. The magnitude of the electrical signal as a function of the m/z ratio is converted by a data processor, which generates the corresponding mass spectrum (21,22). The data from the mass spectra of the raw material aromatic composition, specifically abundance of the different fragments (mass-load relation or m/z) versus the retention time of the constituents, were exported in an ASCII text file. The series of data were subjected to MATLAB 6.5 software to obtain the surface contour plots of m/z versus time for each sample or aromatic composition’s raw material, as shown in Figure 1. After visual analysis of the surface contour plots, the ranges of m/z fragments selected were submitted to principal components analysis using Unscrambler software version 9.5 (CAMO Process AS, Norway, 2002) (23). Data were previously submitted to area standardization
Purchased for the exclusive use of nofirst nolast (unknown)
From: SCC Media Library & Resource Center (library.scconline.org)