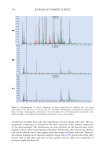
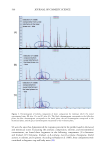
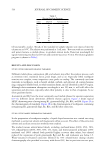
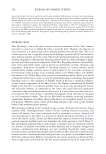
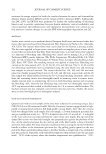
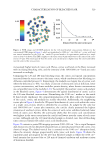
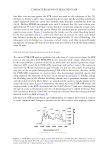
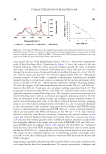
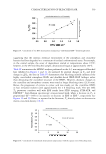
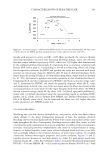
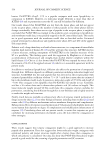
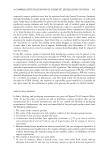
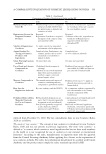
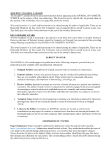
537 CHARACTERIZATION OF BLEACHED HAIR steps are removed (due to small Raman fluorescence artifacts), linear correlations between Raman and FTIR-ATR whole hair fiber EDF analyses are excellent, with R2=0.93–0.98. More importantly, spectral correlations between whole tress and cross-sections analyses are weaker, when judged solely by the magnitudes of scatter plot correlation coefficients (R2=0.60-0.78). In the “FTIR-ATR of Hair Cross-Sections” and “Raman Spectroscopy of Cross-Sectioned Hair” sections, we applied aspect-ratio arguments to justify the use of cross-sections spectra as solely describing chemical changes in the cortex. To complete the rationalization, note that spectra from FTIR chemical imaging of cross-sections were sampled solely from pixels of the hair fiber cortex. Hence, stronger correlations between FTIR imaging and FTIR-ATR/Raman cross-sections spectra, and weaker correlations between FTIR imaging and whole fiber analyses further support the acceptable use of “cortical” when describing the spectral analyses of hair fiber cross-sections. Finally, we have been synonymously referring to the normalized 509 cm−1 band as EDF more accurately, however, the Raman 509/1003 cm−1 band ratio is roughly EDF−1, where increases in cysteic acid are proportional to decreases in cystine (e.g., Figures 11 and 12). Figure 13 looks at the process of cystine bleaching damage through Fick’s laws of diffusion, where a substance is said to follow Fickian diffusion if the normalized solute uptake linearly relates with the square root of process time (24). Figure 13 contains a plot of the process- normalized Raman cysteic acid scattering intensity (1040/1003 cm−1) against the square root of bleaching time. The approximate diffusion coefficient (D) for bleach consumption, as monitored by the conversion of cystine to cysteic acid, was evaluated as 1.1 × 10⁻⁸ cm2min−1. The approximate diffusion coefficient was evaluated from the slope of the graph and the average cross-sectional fiber radius (1,24). The linearity of cortical oxidation with the square root of time generally agrees with the visual interpretation displayed by the FTIR micro-spectroscopic spatial maps exhibited in Figure 3. HPDSC ANALYSIS OF BLEACHED HAIR In the HPDSC method for analyzing the state of hair keratin, snippets of hair are soaked in water and then heated through the denaturation temperature in sealed stainless steel crucibles. By thermally insulting the fiber cortex in the wet state rather than the dry state, water plasticization of the cortical matrix separates denaturation and pyrolysis events (6–15). T D probes the plasticity and viscosity of the matrix, whereas ΔH D represents the Figure 13. Diffusion plot for the normalized Raman EDF band height versus square root of bleaching time. SQRT: square root.

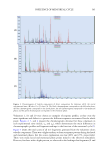
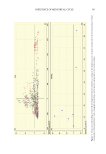
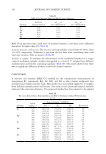
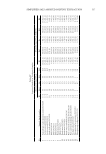
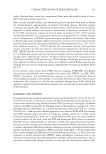
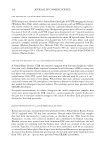
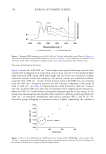
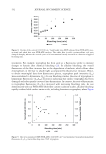
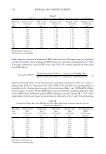
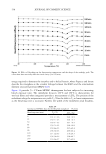
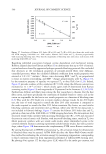
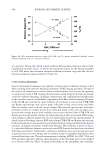
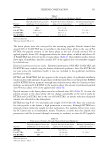
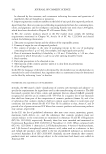
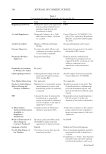
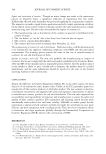
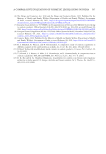
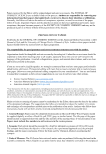
538 JOURNAL OF COSMETIC SCIENCE energy required to denature the interphase and α-helical keratin, where Popescu and Istrate describe the interphase as the covalent linkage between the IFKPs and the intermediate filament associated proteins (IFAPs) (8,13). Figure 14 provides β = 2°C/min HPDSC thermograms for hair subjected to increasing bleach exposure time. The endotherm between 120°C and 150°C is characteristic for wet hair fibers and when integrated provides a measurement of ΔH D . The position of the endotherm along the temperature axis yields T D . Note the shift in T D to lower temperatures as the bleaching time is increased. Further, the width of the endotherm peak broadens, Figure 14. Effect of bleaching on the denaturation temperature and the shape of the enthalpy peak. The curves have been vertically offset for visual clarity (β=2°C/min). Table IV Summary of HPDSC Data for the Bleached Samples (β=2°C/min) Bleaching time (min) TD (°C) ΔHD (J/g) 0 141.3 ± 0.6 19.8 ± 0.5 15 139.7 ± 0.3 19.8 ± 0.3 30 139.5 ± 0.3 19.7 ± 0.5 45 139.2 ± 0.5 19.8 ± 0.8 60 139.4 ± 0.3 19.5 ± 0.4 90 138.3 ± 0.3 18.9 ± 0.4 120 137.1 ± 0.3 17.6 ± 0.3 180 136.3 ± 0.4 15.8 ± 0.7 240 134.6 ± 0.7 10.7 ± 0.8
Purchased for the exclusive use of nofirst nolast (unknown)
From: SCC Media Library & Resource Center (library.scconline.org)