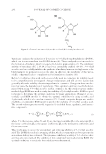
ANTIOXIDANT ABILITY AND STABILITY STUDIES OF 3-O-ETHYL ASCORBIC ACID 235 MATERIALS AND METHODS 3-O-ethyl ascorbic acid was purchased from Cosmol (Gyeonggi-do, Korea). Citric acid was purchased from Nihon Shiyaku Reagent (Osaka, Japan). Methanol (High performance liq- uid chromatography (HPLC) grade) was purchased from Mallinckrodt (St. Louis, MO). Phosphoric acid (HPLC grade) was purchased from Wako Pure Chemical (Osaka, Japan). Methylparaben was purchased from Ueno (Hyogo, Japan). 2,2-Diphenyl-1-picrylhydrazyl, ascorbic acid, sodium phosphate monobasic, sodium phosphate dibasic anhydrous, butyl- ated hydroxyanisole (BHA), and mushroom tyrosinase were purchased from Sigma-Aldrich (St. Louis, MO). Potassium ferricyanide (K3Fe(CN)6), iron (III) chloride (FeCl3), and trichloroacetic acid (TCA) were purchased from Merck (Darmstadt, Germany). L-3,4- dihydroxyphenylalanine (L-DOPA) and kojic acid were purchased from Acros (Morris, NJ). DPPH FREE RADICAL SCAVENGING ABILITY The analytical method was based on the reports by Singh and Rajini and Chan et al. (16,17). The 3-O-ethyl ascorbic acid solution sample (50 μL) was mixed with 50 μL of 160 μM DPPH in ethanol. The mixture was kept in a dark room at 25°C for 30 min. The absorbance of the mixture was measured at 517 nm wavelength using an enzyme-linked immuno- sorbent assay (ELISA) reader (TECANR, Grödig, Austria). Each measurement was per- formed at least twice. The radical scavenging activity was calculated as follows: ¬ ×100% 1– Sample Blank DPPH radical scavenging activity (%)= , A A (2) where ASample and ABlank represented the absorbance of the sample and blank solutions, respectively. A low measured absorbance represented a strong DPPH radical scavenging activity. The antioxidant ability of 3-O-ethyl ascorbic acid was further analyzed based on the ki- netic model provided by Lai et al. (18). A fi rst-order model was used to show the relation between the antioxidant ability and 3-O-ethyl ascorbic acid concentration. dA = – – , dC A k A* (3) – ln(1– )= , A X kC (4) wher e A is the antioxidant ability of the sample, A* is the maximum antioxidant ability of the sample, XA = A/A*, C is the 3-O-ethyl ascorbic acid concentration, and k is the rate constant. Equation 4 was used to generate a linear plot. The slope of the line corre- sponded to the rate constant. REDUCING ABILITY ANALYSIS The reducing ability of the samples was measured following the method described by Lee et al. (19). Samples of the 3-O-ethyl ascorbic acid solution (100 μL each) were placed into

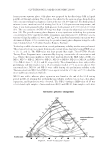
JOURNAL OF COSMETIC SCIENCE 236 vials. Each vial was added with 100 μL of 1% (w/v) K3Fe(CN)6 and 100 μL of 2 mM phosphate buffer (pH 6.6). These mixtures were placed in a water bath at 50°C for 20 min. After the temperature dropped to 25°C, 100 μL of the 10% (w/v) TCA solution was added to each vial. The mixtures were centrifuged at 3,000 rpm for 2 min. Then, 100 μL of the supernatant was transferred to a 96-well plate. Each well contained 100 μL of dis- tilled water and 20 μL of the 0.1% (w/v) FeCl3 solution. The absorbance was measured using the ELISA reader at 700 nm wavelength. A BHA solution was used as the internal standard. Each measurement was performed at least twice. TYROSINASE INHIBITORY ABILITY ANALYSIS Twenty microliter of 3-O-ethyl ascorbic acid (1.5, 6.0, 10.0, 16.0, and 20.0 g/L) was placed in a 96-well plate. Then, 40 μL of a tyrosinase solution (12 U/mL) and 0.1 mM of L-DOPA solution (dissolved in a sodium phosphate buffer at pH 6.8) were added. The mixed solutions were kept at 25°C for 25 min. The absorbance was measured at 475 nm wavelength using the ELISA reader (20). Kojic acid was used as the internal standard. The tyrosinase inhibitory rate (%) was calculated from equation 5: ¬ ×100% control ODsample The inhibition rate (%)= 1– OD (5) The absorbance of the sample (ODsample) and control (ODcontrol) was measured at 475 nm wavelength. The IC50 value was determined from a dose–response curve in which 50% of the target activity was lost. STABILITY ANALYSIS The stability study was based on the RSM experimental design. The concentration of the 3-O-ethyl ascorbic acid solutions was 3 g/100 mL. These prepared solutions were kept in an incubator. After 24-h incubation, the residual amount of 3-O-ethyl ascorbic acid was measured using HPLC. Methylparaben was the internal standard. The ingredient mobile phase including 0.25% (v/v) phosphoric acid and methanol was designed based on the method reported by Kang et al. and Nandhasri and Suksangpleng with slight modifi ca- tions (21,22). The wavelength was set at 254 nm. The fl ow rate was 0.8 mL/min and the injection volume was 10 μL. STATISTICAL ANALYSIS The statistical evaluation was performed using analysis of variance (ANOVA) and regression calculations with STATISTICAR (version 7.0, StatSoft, Inc., Tulsa, OK). All data are pre- sented as mean ± standard deviation (SD). A difference was considered to be statistically signifi cant when the p value was less than 0.05 ( p 0.05). The signifi cance of the regression coeffi cients as associated probabilities was also evaluated. Regression coeffi cients were used to generate a mathematical model to predict the system responses. A 3-D mesh plot and a
Purchased for the exclusive use of nofirst nolast (unknown)
From: SCC Media Library & Resource Center (library.scconline.org)