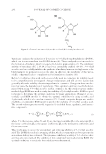
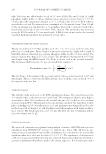
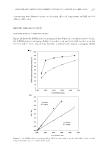
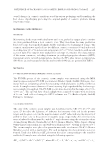
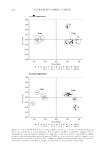
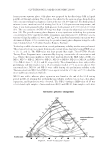
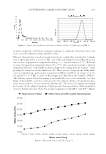
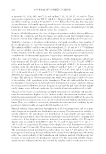
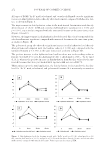
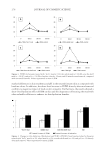
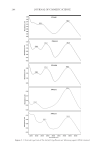
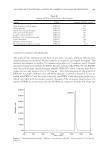
ANTIOXIDANT ABILITY AND STABILITY STUDIES OF 3-O-ETHYL ASCORBIC ACID 239 acid derivative was lower than that of the standard, 3-O-ethyl ascorbic acid still had good reducing ability. TYROSINASE INHIBITORY ABILITY ANALYSIS Tyrosinase catalyzes the formation of DOPAchrome from tyrosine. The product was de- tected at 475 nm wavelength. In this study, the tyrosinase inhibition rate when using a 20.0 g/L 3-O-ethyl ascorbic acid solution was 88.63%. The inhibition rate was also ana- lyzed for 16.0, 10.0, 6.0, and 1.5 g/L solutions. The results are plotted in Figure 4. The linear regression was used to calculate the IC50 value (7.5 g/L) of 3-O-ethyl ascorbic acid. The IC50 value of kojic acid was 0.04 g/L (data are not shown). Kojic acid inhibits the ability of tyrosinase by chelating the copper ion, which is a cofactor of the enzyme (23). This compound has been widely used in Asia as a skin-lightening agent (24). Although kojic acid had a lower IC50 value, it has safety issues, which have been discussed in the past (25). Because 3-O-ethyl ascorbic acid was a stable and effective component, it could be safely used in most cosmetics. STABILITY ANALYSIS 3-O-ethyl ascorbic acid solutions (3 g/100 mL) were kept in an incubator under specifi c temperature and pH for 24 h before running the HPLC analysis. The entire experimen- tal design based on the RSM is shown in Table I. Two independent factors, including Figu re 4. Inhibition rate of tyrosinase activity using 3-O-ethyl ascorbic acid.

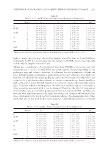
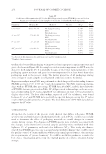
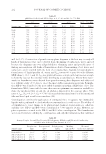
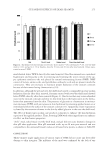
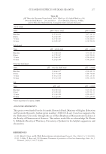
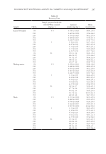
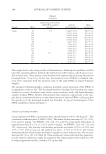
JOURNAL OF COSMETIC SCIENCE 240 temperature and pH, were involved in the RSM regression model. The response value was the peak area ratio of 3-O-ethyl ascorbic acid and methylparaben. Based on preliminary studies, the central point was set to 45°C and pH 6.00. After running the regression analy- sis, the coeffi cients of the second-order regression model were determined and substituted in equation 1. 2 2 1 1 2 2 1 2 = –3.8093+0.1063 – 0.0004 +1.8378 – 0.1222 +0.0139X(6)X Y X X X X This regression RSM model (R2 = 0.822) was used to predict the system’s response. Table II shows the ANOVA results of independent factors from the 3-O-ethyl ascorbic acid stabil- ity study. The p values and regression coeffi cients of the model are shown in Table III. Because the linear term of pH was a signifi cant factor (p 0.05), the peak area ratio was signifi cantly affected by changes in the pH. Thus, 3-O-ethyl ascorbic acid was very sensitive to pH. However, temperature and pH were both included when running the regression analysis. Because the analysis included nonsignifi cant terms, the regression results might be affected by these nonsignifi cant terms and resulted in a reduction of R2 value. Figure 5 Table II Analysis of Variance for the Overall Effect of Factors on 3-O-Ethyl Ascorbic Acid Stability (X1: Temperature, °C and X2: pH) SS df MS F p value X1 (linear) 0.3984 1 0.3984 3.1981 0.1482 X1 (quadratic) 0.0408 1 0.0408 0.3273 0.5978 X2 (linear) 1.1618 1 1.1618 9.3266 0.0379* X2 (quadratic) 0.3454 1 0.3454 2.7730 0.1712 X1 × X2 (interactive) 0.3913 1 0.3913 3.1409 0.1510 Error 0.4983 4 0.1246 Total SS 2.7981 9 *Signifi cant at p 0.05. Table I Experimental Design and Observed Response Values (Area/IS) with Two Independent Factors, X1 (Temperature, °C) and X2 (pH) Run no. X1 X2 Response values Temperature pH Area/IS 1 45.0 (0)a 8.12 (+1.414) 2.176 ± 0.018 2 60.0 (+1) 7.50 (+1) 1.297 ± 0.009 3 66.2 (+1.414) 6.00 (0) 2.887 ± 0.036 4 60.0 (+1) 4.50 (-1) 2.891 ± 0.005 5 45.0 (0) 3.88 (-1.414) 2.962 ± 0.053 6 30.0 (-1) 4.50 (-1) 3.097 ± 0.005 7 23.8 (-1.414) 6.00 (0) 2.973 ± 0.024 8 30.0 (-1) 7.50 (+1) 2.754 ± 0.021 9 45.0 (0) 6.00 (0) 3.021 ± 0.013 10 45.0 (0) 6.00 (0) 2.977 ± 0.030 a (-1.414), (-1), (0), (+1), and (+1.414) are coded symbols for levels of independent factors. Response values are means of three replicates (means ± SD), and they represent the area ratio of 3-O-ethyl ascorbic acid and methylparaben (internal standard, IS).
Purchased for the exclusive use of nofirst nolast (unknown)
From: SCC Media Library & Resource Center (library.scconline.org)