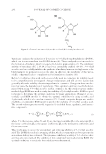
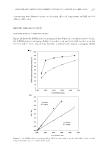
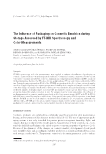
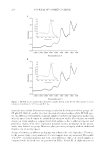
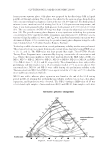
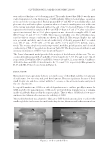
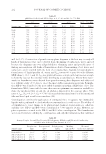
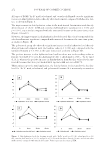
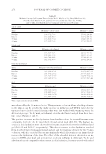
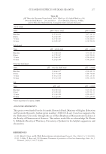
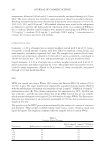
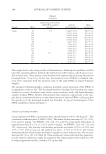
GLUTATHIONE-LOADED NANOEMULSION 259 homogeneous aqueous phase. Oily phase was prepared by the dissolving GSH in liquid paraffi n oil through stirring. The oil phase was added to the aqueous phase drop-by-drop with constant stirring by a magnetic stirrer at the rate of 1,100 rpm (12). The homogenized mixture (coarse emulsion) was left stirring for 2 h, at 1,100 rpm at room temperature, and then, it was homogenized with a high-pressure homogenizer at 15,000 rpm for 10 min (13). The concentration of GSH (450 mg) was kept constant by adjusting each formula- tion (14). The pseudo-ternary phase diagram is very signifi cant in fi nding the optimum concentrations of the ingredients while preparing a nanoemulsion (15). Different concen- trations of liquid paraffi n oil, water, and Smix were mixed and nanoemulsion regions were determined (Figure 1) by constructing the pseudo-ternary phase diagram using the soft- ware Chemix School 3.60 (Arne Standes, Burgen, Norway). To develop a stable o/w nanoemulsion, several preliminary stability studies were performed. These nanoemulsions were made from pseudo-ternary phase diagrams having HLB values 9, 10, 11, and 12. The HLB value was kept greater than eight. Three PTPDs (Pseudo Ternary Phase Diagrams) were constructed by keeping constant the oil concentration and Smix. Thirty-three nanoemulsions (w/w) were made in which the HLB values of NE-1 to NE-6, NE-7 to NE-12, NE-19 to NE-23, NE-13 to NE-18, NE-24 to NE-28, and NE- 29 to NE-33 were 9, 10, 11, and 12, respectively. These formulations were subjected to preliminary stability studies over a 28-d testing period at 25°C in an incubator. Two nanoemulsions, NE-18 and NE-19 were stable during this preliminary stability study. The nanoemulsions NE-18 and NE-19 were again tested for a 90 days at 25°C to fi nd the most stable nanoemulsion (Table I). NE-19 was stable, whereas phase separation was found at the end of the 90-d testing period in NE-18. During this preformulation stability study factors such as color, phase separation, and liquefaction were observed. The NE-19 having a HLB value of 10 was selected and eight samples of nanoemulsions (B-19 and NE-19, four samples each) were Figure 1. Pseu do-ternary phase diagram.

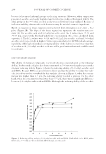
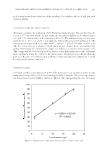
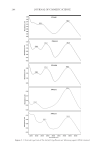
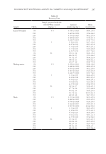
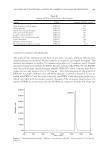
JOURNAL OF COSMETIC SCIENCE 260 repeated and prepared to evaluate the stability studies according to ICH (International Council for Harmonisation) guidelines (16). B-19 was without GSH. Four samples each of B-19 and NE-19 were kept at four different storage conditions which were 4, 25, 40, and 40°C ± 75% RH (Relative humidity) (16) and observed at intervals of 0 h, 24 h, 48 h, 72 h, 7 d, 14 d, 21 d, 28 d, 45 d, 60 d, and 90 d. Color, odor, and liquefaction of B-19 and NE-19 were clarifi ed by means of visual appearance (17). The pH measurements were taken by means of a pH meter (model Zubehorbox pH InoLab, Weilheim, Ger- many). Phase separation analysis was performed by centrifugation of B-19 and NE-19 at 5,000 rpm for 10 min in a centrifugation machine (model: 5810R Eppendorf, Hamburg, Germany). The turbidity of NE-19 and B-19 was noted visually. Flow characteristics were measured with a cone-plate rheometer, using CP41 spindle and operated with the software Rheocalc 1.01 (Brookfi eld Digital Rheometer, Model DV-III, Brookfi eld Engineering Laboratories, Middleborough, MA). The viscosities of fresh NE- 19 and B-19 were measured at 100–200 rpm speed (with 50 increments). All the measure- ments (n = 3) were taken at 25°C on a rheometer For evaluation of fl ow characteristics (16), Power’s Law was applied as follows: IJ = , kDn where, τ = shear stress, D = yield stress (stress at zero shear rate), k = plastic viscosity, and n = shear rate. Analysis of the average diameter is very signifi cant for the confi rmation of nanoemulsion droplet size. The NE-19 was evaluated for mean droplet size, zeta potential, mobility, elec- trical conductivity, and polydispersity by using dynamic light scattering (Zetasizer, model ZS Malvern Instruments, Worcestershire, UK). Measurements were performed at 25°C using a scattering angle of 90° (10). The average droplet size, zeta potential, mobility, electrical conductivity, and polydispersity were recorded for samples of NE-19 (0 d, 30 d, 60 d, and 90 d). STATISTICAL ANALYSIS Statistical analysis was performed using SPSS software by applying two-way ANOVA (Analysis of variance) (16). RESULTS The two nanoemulsions NE-18 and NE-19 were stable after the 28-d testing period, whereas other formulations showed instability at different time intervals (Table I), which Table I Preliminary Stability Study of NE-18 and NE-19 for the 90-d Testing Period Formulations S/No Nanoemulsion code Effects at 25°C, after 30 d 60 d 90 d 1 NE-18 Stable Stable Phase separation 2 NE-19 Stable Stable Stable
Purchased for the exclusive use of nofirst nolast (unknown)
From: SCC Media Library & Resource Center (library.scconline.org)