CLINICAL EVALUATION OF UREA-AMMONIATED DENTIFRICES 6! 77+

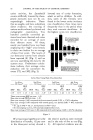
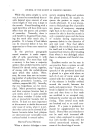
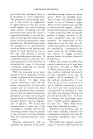
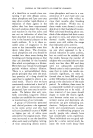
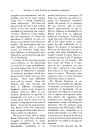
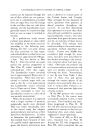
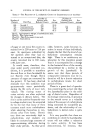
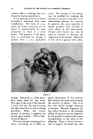
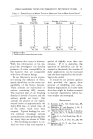
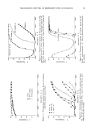
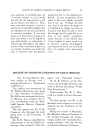
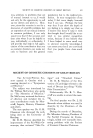
62 JOURNAL OF THE SOCIETY OF COSMETIC CHEMISTS caries activity, but Lactobacilli counts artificially lowered by thera- peutic measures may not be cor- respondingly indicative. There- fore we sought, and have submitted, direct evidence: the counting of carious tooth surfaces by clinical and radiographic examination. Two hundred carefully controlled pa- tients have been observed and caries recorded for an average of more than thirteen years. Of these, nearly one hundred have now been employing this "high" urea formula in their own fashion for an average of about four years. The results of our three-year survey have already been reported (8) [Fig. 1] and we are now assembling the data for the current year. Preliminary calcula- tions indicate that average caries reduction will lie somewhere be- tween 37% and 38% (Fig. 2). lowered rate of cavity formation, adults as well as children. In addi- tion, users of this formula were found in the lowest caries incidence rate classification three times more frequently than in the period when they used cosmetic dentifrices. In the highest caries rate classification $3% 13% 25% DMF rote (Decayed. Missing. Filled per year) groupings of 100 people before using a high-urea dentifrice, Observation 7.8 years 7% 5% OMf Olol.O I.Ilo2.g 2.1103.0 3.1to40 4.1toS.O S.IIe6.0 OVER6.0 RATE I% 6% DMF rate (per year) groupings of some I00 people while using 17% a high-urea dentifrice. Observation 2.9 years I example: 13% were ingrmzp of l.O
For DMF per year or lels before using a high- urea dentifrice. After using o high.urea dentifrice 40% were in this group.
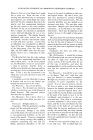
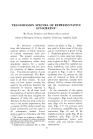
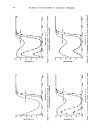
Only Caries Rate Using High Urea Dentifrice 2nd Year, 123 Cases .... DEF per DEF Mos. Year DEF DEF 1st Year• 125 Cases* DEF per Mos. Year 3rd Year, 4th Year, 113 Cases . •--- 87 Casest --• DEF DEF per per Mos. Year DEF Mos. Year 1.37 11.9 1.$8 1.62 12.6 1.5• 1.71 12.2 1.68 1 . 13 11.9 1.29 Three-year average DEF per year: 1.53 Four-year average DEFper year: 1.49 Four-year average (1.49) compared with auto-control period (2.39) = 37.8% reduction Four-year average (1.49) compared with control group, test period (2.48) = 40% reduction * Av. age in 1945 = 34 av. teeth present in 1945 = 26.9. t At time of going to press, 110 cases had completed four years. Four-year average of 110 cases (1.34) compared with control group (2.48) = 45.7% reduction. Figure 2 Of at least equal significance is the distribution of benefit 82 per cent in the three-year survey showed a the relative positions were reversed and in the ratio of five to one (Fig. 3). All reported evidence was de-
Purchased for the exclusive use of nofirst nolast (unknown)
From: SCC Media Library & Resource Center (library.scconline.org)