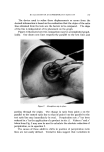
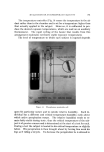
J. Soc. Cosmetic Chemists, 17, 749-767 (1966) A New and Realistic Electronic Approach to the Evaluation of Antiperspirant Activity R. J. JAMES, B.S.* Presented May 10, 1966, New York City Synopsis--A new method for the evaluation of antiperspirant activity eliminates many of the problems inherent in other proposed methods. The use of electronic equipment gives fast results. The use of phosphorus pentoxide cells minimizes the problem of temperature con- trol. Simultaneous measurements are recorded on an X~¾ recorder instead of the strip chart recorder usually used. The method described illustrates the measurement of the dy- namic changes in rates of perspiration. INTRODUCTION Many systems have been devised to measure perspiration in order to evaluate antiperspirant materials. Generally, they can be divided into three classifications. The simplest of these detect perspiration by visual observation of color effects with dyes, starch iodide paper, or spe- cially prepared plastic films (1-4). The next are gravimetric in nature and require the collection of sufficient perspiration to be weighed (5-7). These may either absorb perspiration in pre-weighed pads and absorp- tion cups or freeze it from a gas stream into convenient traps. Finally, there are those methods which sense and record perspiration electron- ically (8-14). Only these are suitable for continuously recording the changes in perspiration rates during a test period. The method to be described is of the last type. * Shulton, Inc., Clifton, N.J. 07015. 749

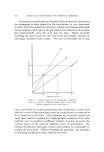
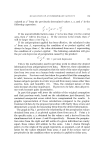
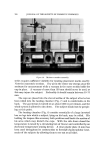
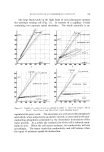
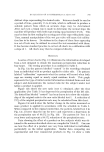
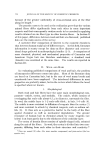
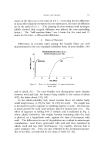
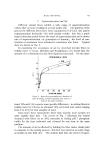
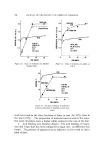
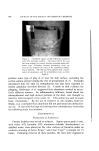
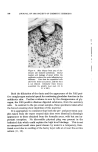
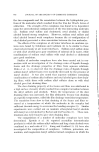
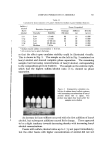
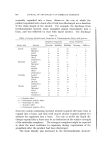
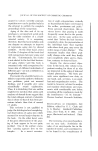
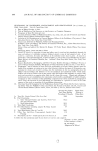
750 JOURNAL OF THE SOCIETY OF COSMETIC CHEMISTS The manner in which data are handled, either as they are obtained by the equipment or later treated by the investigator, is very important. To date, all of the methods devised have erred in one fundamental detail. Those methods which rely on the gravimetric determination of perspira- tion automatically carry the error into the data. Where electronic recording has been used, the error has been unavoidably, though un- knowingly, included in the results. The error is essentially the averag- • I X' X" X Values for Area A Figure 1. Idealized plot of the perspiration output of area A rs. area B. Without product (line 1) and with product applied to area A only (line 2) ing of test results at various perspiration rates to produce a single point ratio for a series of determinations made on a control area as compared to those made on a test area. This situation has occurred because too much time would be required for a single product evaluation if the other methods were to produce a sufficient number of points to assure the constant nature of the ratio for different rates of perspiration. The method described in this paper resolves the problem by continually re- cording the ratio itself. Before describing the procedure, the principles of obtaining perspiration ratios must be reviewed.
Purchased for the exclusive use of nofirst nolast (unknown)
From: SCC Media Library & Resource Center (library.scconline.org)