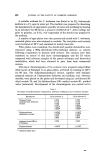
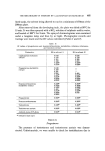
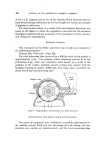
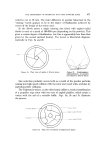
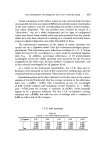
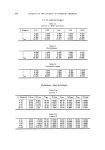
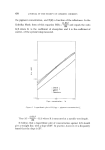
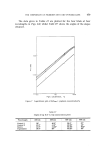
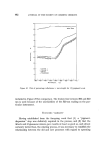
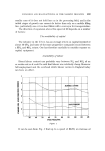
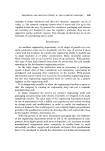
THE DISPERSION OF PIGMENTS INTO DRY POWDER BASE 473 Visual comparison of the surface colour of cakes derived from the three processes did not show any marked differences and microscopic examination of the cake surfaces, and the corresponding dry powders, showed satisfac- tory colour dispersion. The dry powders were checked by means of a "draw-down" test on a white background and no signs of undispersed colour were found. Some control cakes were also produced from dry powder which had only been subjected to mixing in a standard horizontal mixer, and poor pigment dispersion was easily discernible in these. The instrumental assessment of the degree of colour extension was carried out on a Signature model Color Eye colorimeter/abridged spectro- photometer. This instrument gave reflectance readings of x, X, Y, Z from which the three ( .I.E. co-ordinates x, y and z could be calculated together with Yci•-. In addition, percentage reflectances at 16 predetermined wavelengths across the visible spectrum were measured for the 1% level of pigment in the white base, for each method of pigment dispersion, and at four selected wavelengths for all pigment levels. As a check on the instrument repeatability, the C.I.E. data and re- flectances were measured on each of five consecutive working days and the variation from the average calculated. These data are shown in Tables I-III. Detailed inspection of the data collected over the five days on the various samples of Control 2 indicated that the average variation on the reflectance data was q- 0.28% --0.35ø/0 with a maximum at any one wavelength of 0.40 overall variation and maximum overall deviation of q- 0.60% and --0.70ø/0 from the average. A variation of +0.50% would normally appear to be a generous tolerance. For the C.I.E. co-ordinates, average variation was +0.0004, but with two sets of readings with a variation of 0.004 on either side of the averages. C.I.E. data (average) Table Ia Control l•No colour dispersion process Pigment 0.10 0.30 1.00 3.00 10.00 - x 0.320 0.327 0.335 0.350 0.380 y 0.320 0.319 0.320 0.323 0.327 z 0.360 0.354 0.345 0.327 0.293 Yc• 83.620 73.000 62.580 47.360 30.300

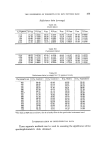
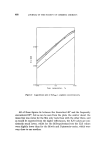
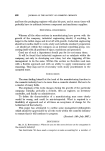
474 JOURNAL OF THE SOCIETY OF COSMETIC CHEMISTS C.I.E. data (average) Table Ib Control 2--Mikro pulveriser % Pigmcnt 0.10 0.30 1.00 3.00 10.00 x 0.325 0.335 0.353 0.377 0.410 y 0.319 0.320 0.322 0.327 0.332 z 0.356 0.345 0.325 0.296 0.258 Yc• 76.350 65.500 47.510 32.940 20.920 x Yci•- Table Ic MoritZmixer 0.328 0.318 0.354 73.280 0.339 [ 0.357 0.319 0.322 0.342 0.321 61.170 i 45.190 0.384 0.327 0.289 29.950 0.411 0.332 0.257 19.880 Table Id Papenmeier mixer x z 0.329 0.319 0.352 71.960 0.340 0.320 0.340 59.870 0.356 0.322 0.322 44.600 0.381 0.326 0.293 30.990 0.414 0.332 0.254 19.100 Reflectance data (average) Table IIa Control 1 • Pigment •oR4OO K/S4oo R5oo K/S5oo R6oo K/S6oo R7oo K/S7oo] 0.10 79.27 0.0271 80.94 0.0225 88.73 0.0072 92.07 0.0034 0.30 69.46 0.0671 69.43 0.0673 81.49 0.0210 87.89 0.0084 1.00 58.42 0.1480 58.17 0.1504 73.40 0.0482 83.44 0.0164 3.00 42.00 0.4010 41.79 0.4050 60.70 0.1272 74.48 0.0437 10.00 24.30 1.179 23.52 1.2430 44.06 0.3550 61.35 0.1217 Table lib Control 2 0.10 0.30 1.00 3.00 10.00 73.29 59.45 42.4O 27.17 15.44 0.0486 0.1345 0.3910 0.9700 02.3100 72.33 58.18 41.10 25.62 13.96 0.0530 0.1530 0.4220 1.0800 2.6500 84.92 75.69 62.22 48.19 34.60 0.0134 0.0390 0.1147 0.2780 0.6180 90.84 85.22 75.71 64.93 52.68 0.0046 0.0129 0.0390 0.0947 0.2120
Purchased for the exclusive use of nofirst nolast (unknown)
From: SCC Media Library & Resource Center (library.scconline.org)