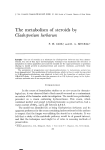
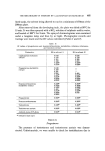
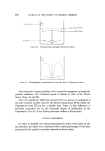
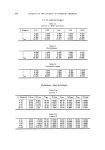
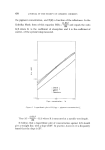
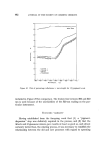
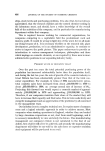
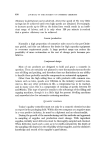
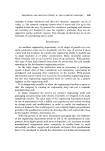
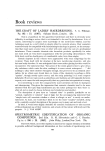
480 JOURNAL OF THE SOCIETY OF COSMETIC CHEMISTS 0'100 /./-'• 0'01( 0'001(•,10 1.00 I0'00 Pigm. concentrotion, % Logarithmic plot of K/Sooo v. pigment concentration All of these figures lie between the theoretical 45 ø and the frequently encountered 87 ø , but as can be seen from the plots the scatter about the mean line was worse for the Mix only tests than with the other three, and as would be expected from the higher reflectances, the K/S values are con- sistently much lower, whilst for the Mikropulverized test the K/S values were slightly lower than for the Moritz and Papenmeier series, which were very close to one another.

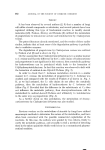
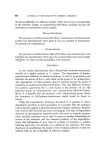
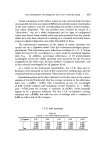
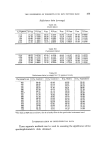
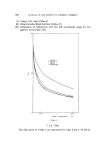
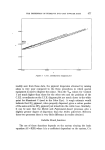
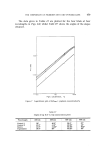
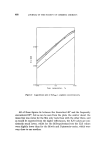
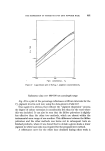
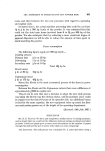
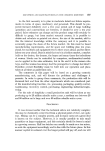
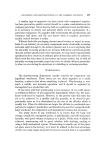
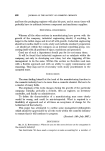
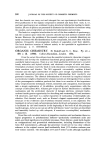
THE DISPERSION OF PIGMENTS INTO DRY POWDER BASE 481 O, IO0 ,• [] 0.010 l , 0'00 '10 1'00 I0'00 Pigm. concentro/ion, % Figure 9 Logarithmic plot of K/S?00 v. pigment concentration Reflectance data over 400-700 nm wavelength range Fig. 10 is a plot of the percentage reflectance at 20 nm intervals for the 1% pigment level in each test, using the data given in Table III. Once again it is obvious that without the "pigment dispersion" process the degree of colour extension is considerably less than for the tests where this was included. It can also be seen that the Mikro pulveriser is slightly less effective than the other two methods, which are almost within the instrumental error range of one another. This difference between the Mikro pu!veriser and the other methods was borne out in subsequent tests on finished products, where it was found that to obtain a given shade a lower pigment to white base ratio was required for the proposed new method. A reflectance curve for the white base obtained during other work is
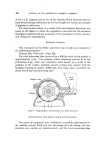
Purchased for the exclusive use of nofirst nolast (unknown)
From: SCC Media Library & Resource Center (library.scconline.org)