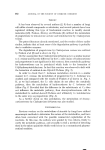
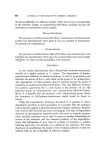
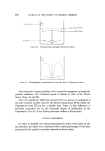
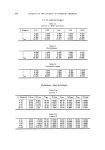
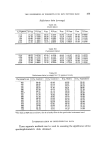
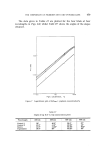
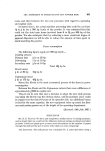
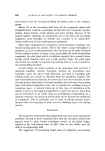
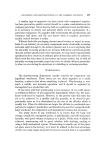
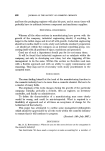
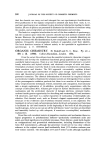
476 JOURNAL OF THE SOCIETY OF COSMETIC CHEMISTS (i) Using C.I.E. data (Tables I) (ii) Using Kubelka Munk function (Tables II) Off) Comparison of reflectances over the full wavelength range for 1% pigment level (Table III). Ioo •x 50 0 x Control I [] Control 2 o Moritz A Papenmeier 1 I 2'00 I0'00 Pigm. concentration, % Figure 4 C.I.E. Data The data given in Tables I are reproduced in Figs. 4 and $. As will be

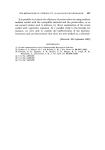
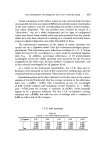
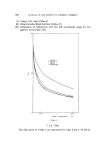
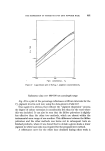
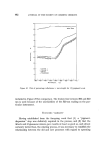
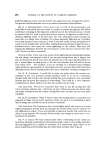
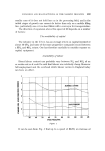
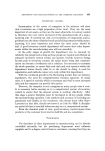
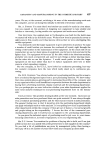
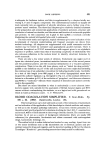
THE DISPERSION OF PIGMENTS INTO DRY POWDER BASE 477 0.330 0,320 0-31C White base 0'300•) 310 0'.'.'550 0.400 x Figure $ C.I.E. chromatictry diagram plot readily seen from these data, the pigment dispersion obtained by mixing alone is very poor compared to the three procedures in which special equipment is used to disperse the colour. Thus the Yc,• values for Control 1 are much higher than those for the other sets and the positions of the C.I.E. co-ordinates on the C.I.E. diagram plot are much closer to the white point for illuminant C (used in the Color Eye). A rough estimate would indicate that 3% pigment, when properly dispersed, gives a colour powder of the same order as 10% pigment just mixed into the white base. Similarly, it can be seen that the Moritz and Papenmeier-based processes give a slightly greater degree of dispersion than the M ikro pulveriser. Between these two processes there is very little difference in results obtained. Kubelka Munk functions The use of these functions depends on the system obeying the basic equation AC=F(R) where A is a coefficient dependent on the system, C is
Purchased for the exclusive use of nofirst nolast (unknown)
From: SCC Media Library & Resource Center (library.scconline.org)