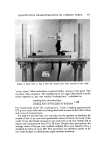
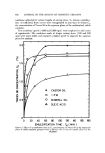
784 JOURNAL OF THE SOCIETY OF COSMETIC CHEMISTS steps in the research organization. The systems used for assembling and screening ideas and the establishment of research projects need to be care- fully analyzed. Responsibility and burden of program and project evaluation lie within research management. Planning activities should focus on the means of directing manpower, equipment, and cost factors in order to meet prescribed goals. Management is forced to choose among several worthwhile projects. The chemist who wishes to have his project accepted must be able to state his goals, his timetable for completion, and his manpower require- ments (1). One of the most widely used planning techniques available today is PERT, an acronym for Program Evaluation and Review Technique (9 0. PERT is a method of managing, a tool used by research management in planning and manipulating various laboratory resources to successfully attain the stated goal. PERT was originally developed by the U.S. Navy to organize the develop- ment of the Polaris Missile system. The application of PERT is not limited to the development of missile systems, but can also be used for most laboratory research projects which meet two criteria: (a) definite objective to be at- tained and (b) independent series of steps which must be successfully per- formed in sequence. PERT is a network system which displays in graphical representation those ordered step-by-step actions which must be carried out in order to reach a specific objective. Before we begin, some basic definitions are in order. Geometrically, the network is composed of two forms. 1. Event-A milestone of progress or accomplishment in the program plan depicting the start or completion of an activity which precedes or succeeds it. Usually represented by a circle. 9,. Activity-A time-consuming element in a program plan representative of work in progress or descriptive of a relationship between two events. Repre- sented by a solid line. 3. Dummy Event-A nonexisting event in actuality, but occasionally insert- ed in a network to simplify the analysis of project status. Represented by a broken line. The previous definitions permit us to extend PERT from a planning tool into a powerful control system by the simple expedient of applying time esti- mates to each activity. Estimates can be made in any unit, but all estimates in the network must be in the same unit. The unit most commonly used is weeks and tenths of weeks. Some of the time involved for completion of a project is not definitely known by management due to unexpected delays or unpredicted speedups PERT makes major recognition of uncertainty by placing it in a standard frame of reference, so that time estimates can be made with a predictable de- gree of success.

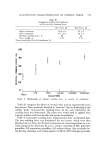
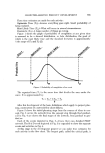
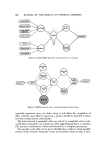
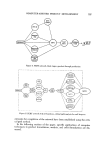
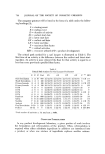
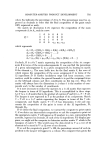
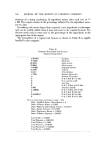
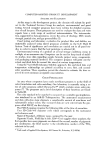
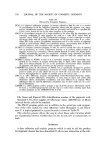
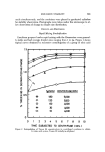
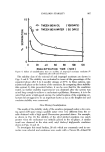
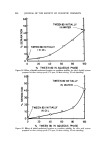
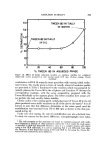
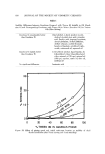
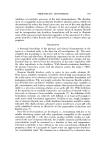
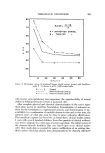
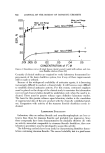
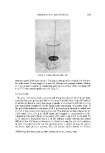
COMPUTER-ASSISTED PRODUCT DEVELOPMENT 785 Three time estimates are made for each activity: Optimistic Time (To)-Assume everything goes right. Small probability of being realized. Most Likely Time (T•t)-What will occur in normal circumstances. Pessimistic (T•,)-A large number of things go wrong. Figure i shows the graph of probability of completion at any given time is assumed to be a skewed distribution, or beta distribution the peak of which is the most likely time and the standard deviation is approximately •t• the range of T•, and To (2). to tm tp Figure 1. Probability of completion of an event The expected time (To) is the mean time that divides the area under the curve. It is approximated by: Te = To + 4 T:u + Te 6 After this development of the basic definitions which apply to project plan- ning, construction of a network flow sheet follows. Figure 2 shows the initial planning steps from the sources of ideas to con- cept, Fig. 3 carries the network from the concept step through final product, and in Fig. 4 are shown the final stages of the network, h'om product to pro- duct:on. Each of the events depicted in Figs. 2-4 have their own detailed PERT network. The R & D event depicted in Fig. 3 is expanded to show the separate events and activities in Fig. 4. At this stage in the development project we can make time estimates for each activity in the flow sheet. The longest path, called the critical path, is
Purchased for the exclusive use of nofirst nolast (unknown)
From: SCC Media Library & Resource Center (library.scconline.org)