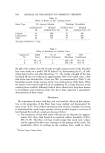
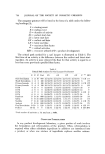
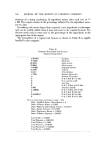
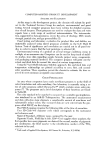
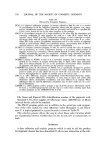
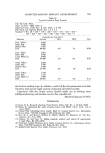
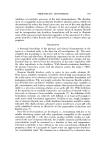
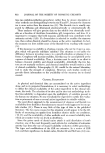
794 JOURNAL OF THE SOCIETY OF COSMETIC CHEMISTS Table III Chroma-Pac Computer Programs PCAL is a pigment calibration program. It accepts reflectance data for one or a number of concentration levels for individual pigments, along with the pigment cost, name, and an identification ntm•ber. These data are processed and stored in a specified file in the correct format for use by the other programs in the package. PMAT is a formulation program. It is single-constant in the sense that the absorption and scattering coefficients of each pigment are used as a ratio (K/S) rather than as separate values. PMAT uses the combinatorial technique in that it attempts to match the target shade with all possible combinations of ND colorants taken N at a time, where ND is the mm•ber of candidate components and N is the ntm•ber of pigments desired in each formula. PMAT uses tritsimulus theory, incorporating data on the 2 ø standard observer, and is available with a ntm•ber of illuminants. PCOR1 is a formula correction program. It may be used to correct the color of material now in production, to correct a laboratory formula, or to produce initial matches of superior accuracy by correcting a library sample formula to match the target shade. PCOR1 automatically corrects for production variables using internally calculated correction factors. PCOR1 requires reflectance input for both the sample and the standard. PCOIt2 is similar to PCOItl in that it is a correction program, but is somewhat more limited in use because it accepts tristimulus data as input rather than reflectance data. It is meant primarily for use in the production environment where simplicity of operation and speed of correction are the primary requirements. UNKNWN has many of the features of PMAT, but is specifically designed to produce production formulas incorporating a maximum of "waste" material while maintaining product quality. It not only allows the user to "work-off" such material, it also shows how to accomplish this as rapidly as possible and at the lowest cost. FMC is a color difference program incorporating Friele-MacAdam-Chickering mathe- matics. It accepts reflectance, tristimulus, or ratio data as input and prints CIE tristimulus values, chromaticity coordinates, and color differences as outputs. When reflectance data are entered, tristimulus integration may be done under any of a nmn- ber of illuminants. LISTEft is a utility program used to prepare a log of all the primary information stored. It serves a record-keeping function and the logs are useful when entering input data to other programs in the CHItOMA-PAC I series. File Name and Pigment ID's-Identification number of the pigments used. Standard % R's-User supplies 16 reflectance values (400-700 nm) at 20-nm intervals for the color to be matched. The PMAT program prints out, in addition to the actual per cent composi- tion of the color match, the color difference under Illuminant A and Illumi- nant C. A typical printout for a paint formula is shown in Table IV. This selection process allows the user to select those color formulas which are of particular interest, whether they be low in cost, low in metamerism, or both. SUMMARY A data collection and analysis program which is used to aid the product development chemist has been described. It allows user interaction at the criti-

COMPUTER-ASSISTED PRODUCT DEVELOPMENT Table IV Typical Printout of Paint Formula 795 User ID Code: BILL Naxne of STD.: TEST STD. C Pigments/Coxnb., Field Size, & Sub. ID•p: 3 5 380 File Name and Pigment ID•pS: Test i 2 3 4 5 Standard % R's: 26 ß 235 ß 736 ß 235 ß 034 ß 434 ß 434 ß 534 ß 735 ß 638 ß 340 ß 340 ß 840 ß 640 ß 239 ß 939 ß 6 Formulas for Test Std. C Pigments Amount DEA DEF Cost Prim. Yellow 3.062 Oxide Red 6.289 Phthalo Blue 0.227 TiO2 90.422 Prim. Yellow 1.601 Oxide Red 3.652 Lamp Black Lt. 0.468 TiO• 94.2'80 Oxide Yellow 2.925 Oxide Red 5.446 Phthalo Blue 0.245 TiO• 91.385 Oxide Yellow 1.515 Oxide Red 3.113 Lamp Black Lt. 0.485 TiO,o 94.887 4.6 1.4 9.58 1.0 0.4 5.72 2.9 1.6 8.62 0.0 0.2 5.11 cal decision making steps. In addition, control of the test parameters and data reduction steps permit rapid analysis of physical and chemical data. Experience with this simple system should enable one to develop more intelligent planning and broader uses for this valuable tool. (Received January 9, 1973) REFERENCES (1) Faust, R. E., Research planning, Drug Cosmet. Indus., 111, No. 1, 42 (July 1972). (2) Walck, R. Organizing the small research project with PERT, Chem. Tech., 334-9 ( June 1972 ). (3) Critical Path Scheduling-Users Guide, Mark II, General Electric Co., Information Service Dept., 7735 Old Georgetown Rd., Bethesda, Md., 1968. (4) Gere, M. J., and Weaver, William Jr., Matrix Algebra For Engineers, D. Van Nos- trand Co., Inc., N.J., 1965. (5) Kaplow, R., and Posn, H., Online computer analysis and control of experiments, J. Appl. Phys., 40, 4948 (1969). (6) Numerical Analysis Routines-Users Guide, General Electric Co., Information Service Dept., 7735 Old Georgetown Rd., Bethesda, Md., 1968. (7) Applied Color Systems Users Guide, Princeton, N.J., 1972.
Purchased for the exclusive use of nofirst nolast (unknown)
From: SCC Media Library & Resource Center (library.scconline.org)