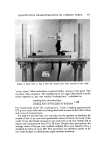
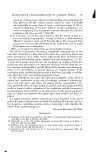
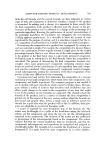
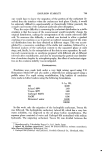
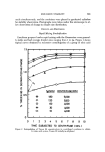
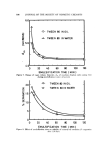
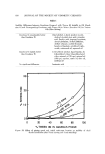
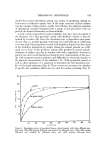
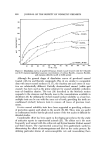
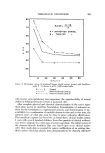
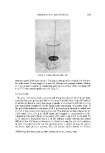
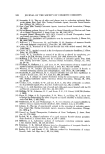
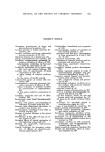
EMULSION STABILITY 803 The values of Co were then plotted against T. •o study the change in surfac- tant concentration as the mixing time increased. An example of such a plot is shown in Fig. 2 for oleic acid, mineral oil, isopropyl myristate (IPM), and castor oil systems in which the migrating surfactant, Tween 80, was initially placed in the oil phase. Figure 3 shows the curves for the similar systems in which Tween 80 was initially placed in the aqueous phase. The fiat portion of the curve indicates that no further migration is taking place, i.e., the system has apparently reached an equilibrium with respect to the surfactant move- ment. 2.5 z ,1.5 z 8 z 0.5 0 C ASTOR O I L IPM MINERAL OIL OLEIC ACID I i I i 40 60 80 100 EMULSIFICATION TIME, I I I 120 140 160 T e (MIN) 180 Figure 3. Effect of emulsification time on C., concenh'ation cf Tween 80 in the cor•tinuous phase of stable emulsion, prepared with 4 different oils (Tween 80 initially placed in the water phase)

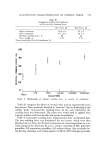
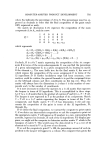
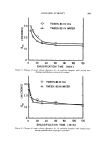
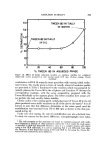
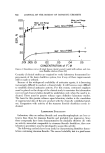
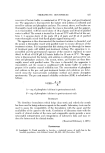
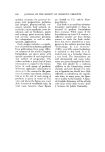
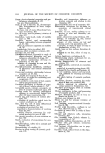
804 JOUBNAL OF THE SOCIETY OF COSMETIC CHEMISTS It can be seen that different oils required different lengths of time to reach surfactant equilibrium even though the mixer speed was set constant at 11,- 900 rpm in all cases. For example, isopropyl myristate required less than an hour whereas oleic acid required nearly oe hours before the apparent equilib- rium was attained. The particle size distribution of each emulsion was measured from micro- photographic prints by counting and the result was expressed in terms of mean volume diameter, din, defined as follows: dm- • n where n is the number of droplets and d is the droplet diameter. The results of d• as a function of emulsification time, Te, are presented in Figs. 4-7. By comparing the d• curve against the corresponding Co curve, it is interest- ing to note that the time required for the emulsion droplets to reach a mini- mum was •approximately equal to, or slightly less than, the time required to reach surfactant migration equilibrium. Apparently, under a high mixing speed, very little migration took place once the droplets were reduced to the minimum size and the adsorption at the interface was completed. 4'01 ' , -0- 3.0 I I I I I I I I I ] TWEEN 8O IN 01L TWEE N 80 I N WATER E 'o 1.0 I I I I I I I I I I 20 40 60 80 100 120 EMULSIFICATION TIME (MIN) Figure 4. Change of mean volume diameter, d .... of emulsion droplets with mixing time during emulsification (oleic acid system)
Purchased for the exclusive use of nofirst nolast (unknown)
From: SCC Media Library & Resource Center (library.scconline.org)