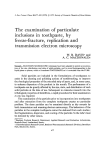
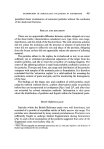
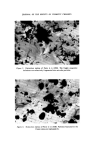
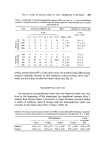
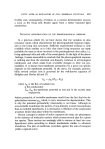
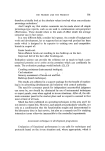
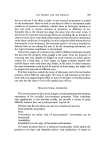
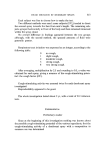
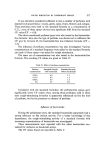
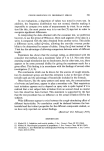
FATTY ACIDS AS REGULATORS OF CELL MFMBRANE FUNCTIONS Figure 1. Phoreographical skin response to cathodic stimulation in the rat. Facing page 486

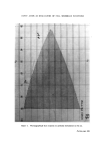
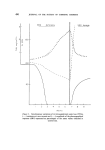
FATTY ACIDS AS REGULATORS OF CELL MEMBRANE FUNCTIONS 487 In addition each rat was given orally, once weekly, 0.02 g of a mixture of vitamins (A, D and E). The dose corresponds to 300 i.u. vitamin A, 10 i.u. vitamin D and 3.3 i.u. vitamin E. After 2 months on the diet, the rats received a daily dose of 0.1 ml of sunflower seed oil (SSO) corresponding to 5 mg of linoleic acid. Six rats fed on a control diet for the whole duration of the experiment served as controls. Phoreographical measurements These were carried out using two silver/silver chloride electrodes which are applied on a clipped skin area in the dorsal region of the animal. The surface of the exploring electrode (q 1 cm) was ten times less than that of the indifferent electrode. Beckman conductive paste was used to ensure close contact of the electrodes. Current was applied to the skin from a direct current (d.c.) pulse generator in which the pulse duration and periodicity were adjustable. A motor-driven potentiometer fed an increasing voltage (0-30 V) in a linear manner into the circuit the latter included a 3 M• resistor in series with the skin. Since the resistance of skin is low as com- pared with 3 M•, changes in skin resistance were assumed not to interfere, or only in a negligible manner, with the ramp-intensity clamp procedure. A Keithly electrometer and a Servogor recorder were used to register the phoreographical response. The current intensity was increased stepwise within the range 0-10 IrA 1 s pulses were interrupted by intervals of equal duration the intensity was increased to its maximum level within 90 s. The maximum intensity was then applied for 10 s, followed by pulses of decreasing intensity (10-0 IrA) for another 90 s. The stimulation is said to be cathodic when the exploring electrode is connected to the negative pole of the stimulator and anodic when the polarity is reversed. The general pattern of the cathodic response is shown in Fig. 1. The critical point marking the change of slope is called the threshold and the liminal intensity (It) is defined as 10xn It- 45 where n is the number of pulses below the threshold. In this paper only the cathodic response will be considered. The animals were under slight ether anaesthesia during the measure- ments which required 2-3 min each. After several trials, it seemed more to
Purchased for the exclusive use of nofirst nolast (unknown)
From: SCC Media Library & Resource Center (library.scconline.org)