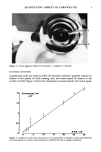
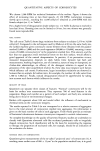
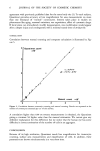
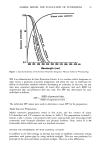
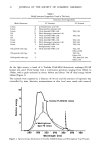
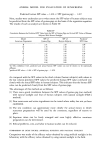
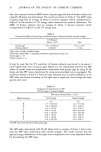
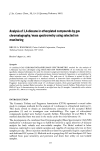
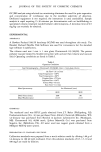
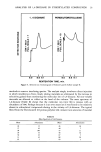
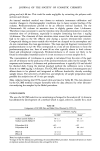
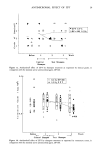
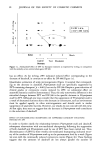
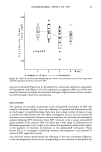
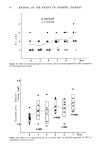
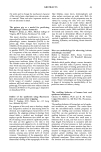
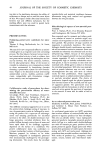
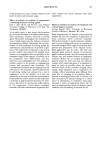
ANALYSIS OF 1,4-DIOXANE IN ETHOXYLATED COMPOUNDS 21 The internal standard perdeuterotoluene solution was made from a stock solution of 1.00 g diluted to 100 ml with methanol. This was volumetrically diluted to 10 mg/l in either water or methanol depending upon the solubility of the samples. A calibration curve was made by mixing 5.0 ml of each 1,4-dioxane standard with 1.0 ml of the perdeuterotoluene standard and diluting to 10 ml volumetrically with methanol. Injections of 3 /zl each were made. The peak areas for 1,4-dioxane and perdeuteroluene were ratioed and plotted vs. 1,4-dioxane concentration. A typical lower concentration curve is shown in Figure 1. The calibration curve is linear from 0.5 1.1.1 4.0 o 3.0 2.0 1.0 5 1,4 DIOXANE CONCENTRATION, mg/kg lO Figure 1. 1,4-Dioxane standard curve using perdeuterotoluene as an internal standard. to 1000 mg/l. A selected ion chromatogram of a 1.0 ppm 1,4-dioxane standard is shown in Figure 2. Both the 1,4-dioxane and perdeuterotoluene solutions were stable for at least one month when stored in glass bottles with aluminum-lined caps. One standard in the concentration range being investigated was run twice a day to verify calibration. PREPARATION AND ANALYSIS OF SAMPLES Samples were prepared by mixing 5.00 g of sample with 1.00 ml of perdeuterotoluene solution and diluting to 10 ml volumetrically with methanol or water. Injections of 3/zl

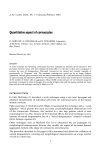
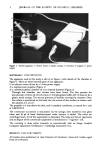
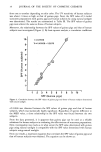
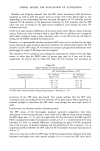
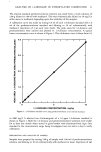
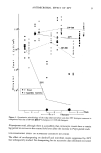
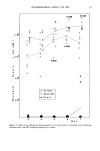
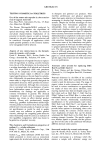
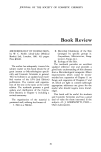
22 JOURNAL OF THE SOCIETY OF COSMETIC CHEMISTS 1,4 DIOXANE I I I 8.0 8.6 9.1 PERDEUTEROTOLUENE I I I 8.0 8.6 9.1 RETENTION TIME, min. Figure 2. Selected ion chromatogram of 1.0 mg/kg 1,4-dioxane standard. each were made. Operating conditions are listed in Table I. During the chromato- graphic run, the mass spectrometer was isolated from the GC effluent except during a narrow retention-time window when the 1,4-dioxane and perdeuterotoluene are eluted. The program also included a brief bake-out to clear the column of volatiles before the next analysis was begun. Non-volatile materials were allowed to collect at the injection end of the column. The accumulation of these materials usually had no effect except to increase the baseline of the chromatogram with time. When the column noise approached one-half the response of a 0.5 mg/kg 1,4-dioxane peak, the column was removed, unpacked, solvent cleaned, dried, repacked and re-installed on the instru- ment. In practice a second column would be kept available, in which case only 15 min of down-time could occur. With the sample matrices discussed, 75-80 sample injections can be made before the column must be cleaned or exchanged. This usually means changing columns once per week. Figure 3 is a selected ion chromatogram of a Sodium Laureth Sulfate sample found to contain 9.3 mg/kg 1,4-dioxane. RESULTS AND DISCUSSION The use of a GC/MS selective ion monitoring technique for the analysis of 1,4-dioxane has eliminated the need for extensive sample pre-treatments and/or column switching
Purchased for the exclusive use of nofirst nolast (unknown)
From: SCC Media Library & Resource Center (library.scconline.org)