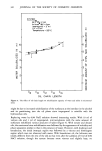
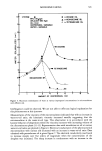
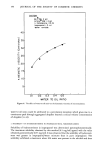
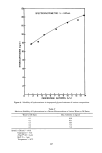
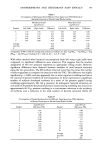
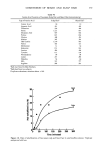
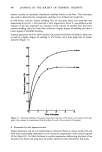
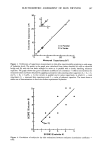
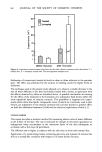
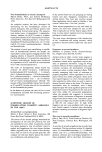
ELECTROMETRIC ASSESSMENT OF SKIN DRYNESS 387 30- 20 IO / 0 I I • I o IO 0 In Parallel [] In Series I I • I • I • I 20 30 Measured Capacitance (nF) Figure 1. Verification of capacitance measurements in skin after experimentally producing a wide range of hydration levels. The points in the graph were calculated from values obtained (a) with an electrical bridge and (b) with the test leads arranged in series or in parallel with a closely matching reference capacitor. The graph shows that good correlation (coefficient of correlation -- 0.98) is seen between the measured values and those obtained by applying summation rules assuming ideal capacitors C t = Cs q- C• and Ct = (Cs x C•)/(Cx q- C•) for circuits in parallel and in series respectively, in which C• = total capacitance, Cs = measured skin capacitance and C• = value of reference capacitor. The insert shows a similar set of determinations in three sites before experimental hydration. _ ß •'(n=7) a I • I • [ , I I I I 2 3 4 5 SCORE (Evolua•or A! Figure 2. Correlation of subjective dry skin evaluations between evaluators (correlation coefficient 0.83).

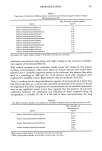
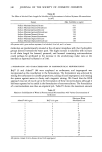
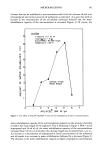
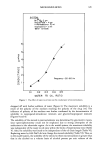
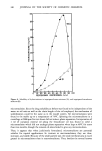
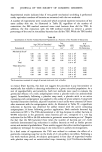
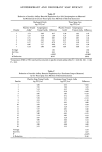
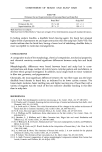
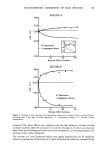
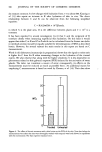
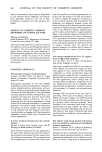
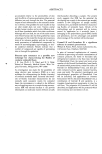
388 JOURNAL OF THE SOCIETY OF COSMETIC CHEMISTS WDi 15 I0 I--I Normal { n= 7) K'q Medium-dry (n= •3 ) Dry (n= 7) 1.0 1.5-3.5 4-5 Average Dryness Scores Figure 3. WDi determined electrometrically in skin with different degrees of dryness evaluated subjectively ! = absent, 1.5-3.5 = slight to moderate, 4-5 = intense. The bars represent standard error. scores for the dry skin subjects were less consistent. This was to be expected in view of the great complexity involved in recognizing and quantifying parameters associated with so-called dry skin (5, 10). Despite this, the regression coefficient for the dry group is high enough (0.7) to suggest that different degrees of dryness were detectable within this population. Figure 3 shows the relationship between the WDi values and the subjective skin dryness. To simplify analysis, the dry skin group is presented as two categories, medium dry and dry, based on the scores ranging from 1.5 to 3.5 and 4 to 5, respectively. The numerical differences in the figure indicate a direct relationship between the WDi values and the degree of superficial skin dryness. However, statistical analyses of data (Table I) show that the differences were significant (P = 0.05) only when comparing the normal group to either the medium dry or dry group. A typical pattern of C readings obtained from two subjects, one of whom had dry skin, is illustrated in Figure 4. This shows that occlusion causes a gradual increase in capacitance associated with a drop in impedance. Immediately following the occlusion with petrolatum (Figure 4 insert) a temporary increase in Z and decrease in C can be Table I Statistical Comparison Between Dry, Medium Dry, and Normal Skin Evaluated Electrometrically Geometric Mean Ratio Comparison of WDi Values P Value 95% Confidence Interval Dry/Normal 2.47 .016 1.20, 5.08 Medium/Normal 1.97 .036 1.05, 3.71 Dry/Medium 1.25 .528 0.61, 2.57
Purchased for the exclusive use of nofirst nolast (unknown)
From: SCC Media Library & Resource Center (library.scconline.org)