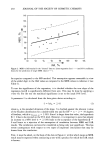
294 JOURNAL OF THE SOCIETY OF COSMETIC CHEMISTS 200 160 ,2ø t o 70 / / / / / / / / / / / / / / / ' ' 160 • ' 80 90 110 120 130 MBR, % Figure 3. IA vs MB test results (analogous to Figure 2) and 95% confidence limits for the inverse prediction of single IAR values from MBR data (---). Solid line gives the IAR value predicted on the basis of the MBR = f(IAR) correlation given in equation 4. The 95% confidence bands for the inverse prediction are shown in Figure 3. The solid line gives the predicted •i (z IAR) values. The values for selected products to represent the data range are given in Table III. To compare the results for the IA and MB tests on a semantic basis, adapted from that applied for consumer-related testing (3), the results for each of the two tests are grouped into four classes, namely very good (class 1, + + ), good (class 2, + ), acceptable (class 3, o), and unacceptable (class 4, -). The class widths were chosen to comprise the range of the cleaned data set in Figure 2, where the position of the classing scheme was set such that the center of class 3 (acceptable, o) was 100%, i.e., the value for unchanged skin Table III MBR and IAR Values for Selected Cases and the Minimum and Maximum Values for the 95% Confidence Range of the Prediction of IAR Values From MBR Results (all values in %) MBR value IAR value R value Product no. measured measured predicted min 95% Confidence range for IAR prediction max 1 78.7 94.86 85.1 - 7.7 109.8 7 90.0 94.70 91.8 39.7 115.9 13 100.6 95.97 98.0 69.8 136.0 19 110.3 102.55 103.7 80.5 171.3 22 122.7 95.91 111.0 83.9 226.7

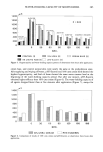
SKIN ROUGHNESS ASSESSMENT 295 Table IV Number of Products in Four Different Classes, Characterized by Their Means and Their Widths (given in brackets) for MB and IA Testing of 22 Skin Care Products MB test (16) IA test (4) Descriptor Mean Number of cases Mean Number of cases Class 1 + + 68 0 92 5 Class 2 + 84 8 96 12 Class 3 o 100 9 100 1 Class 4 - 116 4 104 3 roughness. Table IV summarizes for the test procedures the positions of the classes and the number of products found therein. The ratings for the individual products according to MB and IA testing and based on this scheme are given in Table I. DISCUSSION The results of Figure 1 show that there is initially no correlation between MBR and IAR values. Only a reduced data set without the outlier (IAR -- 57.09) leads to a correlation that is just significant on the 95% confidence level (see Figure 2). Such a correlation would be of practical value if it could be applied for calibration purposes, namely for the accurate prediction of an unknown MBR value of a product from its IAR value or vice versa. The 95% confidence range for the predicted MBR values in Figure 2 indicates that already the first task is rather difficult. As Table II shows for four cases, chosen to cover the observed range of IAR values, the predicted MBR values are already between 4 and 10 units off the mark. The situation worsens when the minima and maxima of the possible range for the MBR values are considered. In all cases and regardless of the IAR value, the possible minimum value is within the range of the well-performing and the maximum value in the range of the badly performing products. Even for the product performing best in image analysis (No. 3, IAR = 90.94, + + ), its MBR value can be expected to be somewhere between MBRmi n = 65 (better than + +) or MBRma,, = 112 ( - ). The worst performing product in image analysis (No. 15, IAR = 102.54, - ) might actually do quite well in MBR testing (MBRmi n = 84.5, q- ), but it might also come out as totally unacceptable (MBRma,, = 132, worse than -). The comparison between Figures 2 and 3 shows that the situation even worsens if the correlation is applied as a calibration to predict IAR values from values obtained via the MB method, which is more practical to apply. The results summarized in Figure 3 are detailed for five cases in Table III, showing that the predicted IAR values are between 1 and 15 units off the mark. The 95% range for the IAR-predictions shows that in all cases unrealistic values are obtained, either for the minimum or the maximum, so that no power can be conceded to MB testing to predict IAR values. Taking the image analysis as the objective test method and providing the independent
Purchased for the exclusive use of nofirst nolast (unknown)
From: SCC Media Library & Resource Center (library.scconline.org)