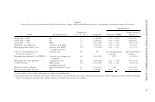
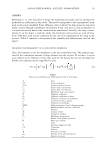
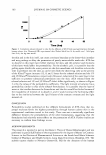
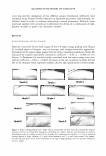
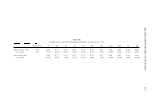
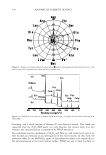
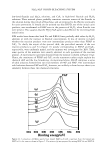
108 JOURNAL OF COSMETIC SCIENCE 5 12 individual surface contour scans in equal increments. Trigonometric calculations of the 2D coordinates to three-dimensional (3D) space are performed. The outer aspects of both thighs were scanned (402 x 170 mm in 40 sec at 0.5 x 0.38 mm planar resolution) while subjects sat on a level surface with knees bent at a 90° angle. The scanner was raised and lowered with the aid of a special motor-controlled platform to allow accurate positioning of the subject within the scan area. The quan titative surface roughness parameters were calculated from the scan data with a custom ized version of TrueMap Software (TrueGage, N. Huntingdon, PA). The images were first processed to remove non-cellulite features. The form removal utility applied an LS third-order polynomial equation to remove the thigh curvature. The filtering utility, set at 0.25 mm, removed noise due to movement, hair, and varicose veins. Remaining anomalies were deleted with an outlier routine. The surface roughness parameters (Table I) were calculated for the region of interest (10.7 x 11.3 cm, center of the thigh) (22). VISUAL SCORING OF CELLULITE Expert image scores. Three research team members reviewed 66 3D laser scans (gray scale images on a black background) that covered the range of severities observed in the general population. They identified the cellulite features and developed a ten-point classification scale of cellulite severity (0-9) wherein 0 represented no cellulite 1, 2, and 3 indicated varying degrees of slight cellulite 4, 5, and 6 indicated moderate cellulite and 7, 8, and 9 indicated severe cellulite. We selected ten images, representing each point (0-9), for evaluation by nai've judges and established the ten images as the expert image grading scale. Table I 3D Surface Roughness Parameters (22) Parameter Description Sa Average roughness (mm): Average of the absolute distances of the surface profile from the reference plane Sq Root-mean-square roughness (mm): Width or variance of the amplitude distribution function Sp Maximum profile peak height (mm): Height of the highest profile peak above the reference plane Sv Maximum profile valley depth (mm): Depth of the lowest profile valley below the reference plane St Maximum height of profile (mm): The vertical distance from the highest peak to the deepest valley (St = Sp + Sv) Ssk Skewness (mm): Symmetry of the roughness profile variation about its mean Sku Kurtosis (mm): Spikiness of the roughness profile Spm Mean maximum profile peak height (mm): Mean height of the highest peaks over the entire surface Svm Mean maximum profile valley depth (mm): Mean depth of the lowest valleys over the entire surface Sz Mean maximum height of profile (mm): Mean vertical distance from the highest peaks to the lowest valleys over the entire surface (Sz = Spm + Svm) Sdr Surface area ratio (% ): The ratio between the roughness surface area and the area of the flat xy plane. For a flat surface, the surface area and the xy plane area are equal, and Sdr = 0%

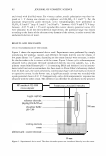
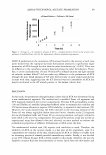
QUANTITATIVE MODEL OF CELLULITE 109 Live visual grades. The lateral thighs were evaluated with the subject positioned on a bicycle seat (to avoid thigh compression) with the knees bent at 90° angles. A trained judge scored the outer aspect of each thigh using the following scale: 0 (smooth, no dimples), 1 (shallow, small visible dimples, few and sparsely located), 2 (moderate number of visible dimples, some large), 3 (large number of dimples, many large, over most of the surface, cottage cheese appearance), and 4 (wide, deep visible dimples over entire thigh, very prominent cottage cheese appearance). Half-point increments were used for intermediate conditions, resulting in ten increments: 0, 0.5, 1.0, 1.5, 2.0, 2.5, 3.0, 3.5, 4.0, and 4.5 (for grades higher than 4.0). MEASUREMENTS Weight, height, and thigh circumference were measured using a standard hospital scale with height bar and measuring tape. Sites at the center lateral thighs were demarcated with a 2-cm diameter area centered within a 5-cm diameter circle. DUAL-ENERGY X-RAY ABSORPTIOMETRY (DEXA) Total and regional body composition (lean and fat mass) was measured with a dual energy x-ray absorptiometry (DEXA) total body scanner (Hologic Inc., San Francisco, CA) at the body core composition laboratory of the General Clinical Research Center of Cincinnati Children's Hospital Medical Center. Fat percentages were calculated for the total body, thigh, thigh subregion (area of ultrasound and biomechanical measure ments), android (torso), and gynoid (hip/thigh), using joints as landmarks. The body fat distribution was calculated from the android/ gynoid fat mass ratio, an index of the fat allocation amid the torso and hip/thigh regions (23). ULTRASOUND Dermal thickness (mm) and the dermal-subcutaneous junction surface area (mm2) of the thigh sites were determined using the Dermascan C® Version 3 (Cortex Technology, Hadsund, Denmark) with a 20 MHz 3D probe (24). A 22.4 x 22.4 mm area was scanned with an interslice distance of 0.2 mm, providing 112 B-scans (2D images). The acoustic velocity of the instrument was set to 1580 mis (24). The mean dermal thickness (112 B-Scans) was determined with the Dermascan C® software to define the outer boundary of the epidermis and the inner dermal/subcutaneous fat boundary. The surface area of the 3D dermal/subcutaneous junction was reconstructed by manually delineating the der mal/subcutaneous border from 50 consecutive B-Scans (224 mm2 area or 50 scans x 0.2 mm z-dir x 22.4 mm y-dir). SURFACE TEXTURE WITH PHOTOGRAPHY Surface texture under compression was measured with an Accentuated Cellulite Imaging System (ACIS, Procter and Gamble, Cincinnati, OH). The thigh was compressed with gripping handles to 11.6 mm from a starting point of zero. Moisturizing lotion (Oil of Olay Beauty Fluid, Procter and Gamble, Cincinnati, OH) was applied prior to the measurement to eliminate confounding the effects of dry skin. Digital images were
Purchased for the exclusive use of nofirst nolast (unknown)
From: SCC Media Library & Resource Center (library.scconline.org)