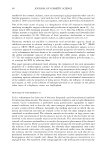
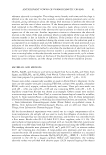
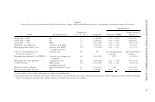
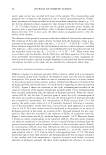
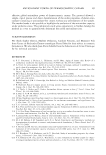
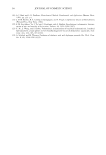
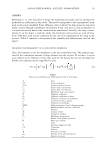
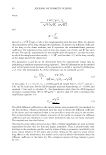
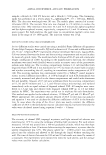
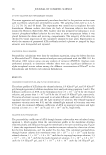
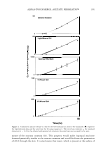
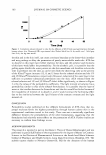
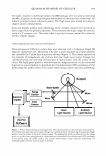
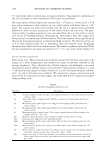
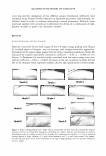
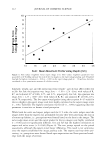
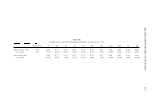
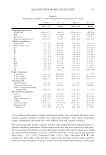
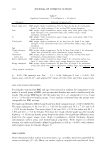
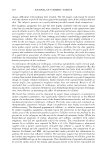
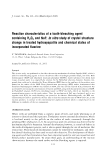
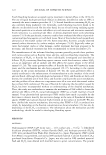
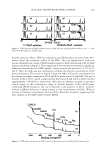
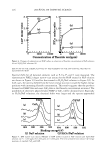
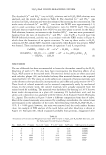
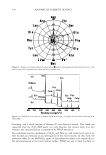
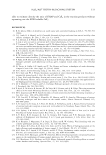
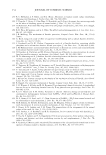
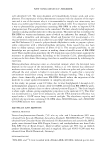
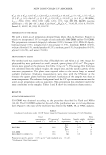
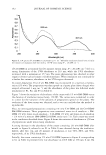
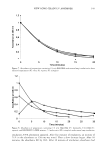
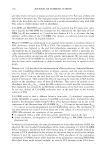
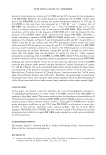
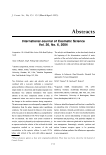
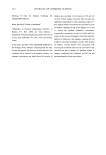
124 JOURNAL OF COSMETIC SCIENCE Table I Dissolution of Calcium and Phosphate Ions from HAP, and the Subsequent Crystal Structure Changes in Hydrogen Peroxide (H202) Solutions No. H2O2 (%) Ca (x 10- 5 mol) P (x 10- 5 mol) Ca/P ratio XRD pattern of product 1 0 0.6 1.1 0.55 HAP 2 15 1.3 1.9 0.68 HAP 3 30 1.4 2.0 0.70 HAP around 6.0 after these reactions. From the dissolution data, surface alterations on the HAP were evident. The released Ca/P molar ratios, which differed from the stoichio metric ratio for HAP, indicated so-called incongruent dissolution (42). X-ray diffraction patterns of the untreated HAP and the HAP treated in H2O2 (15%, 30%) for two hours are shown in Figure 1. There were no apparent changes in crystal structure, and all these patterns were characteristic of the HAP structure, suggesting that the changes were limited to the outermost surface of the HAP. Ca10(PO 4 ) 6 (OH)2 + SH+ ➔ 9Ca2+ + SHPO/- + CaHPO 4 • 2H 2 O (1) CaHPO 4 • 2H 2 O + H+ ➔ Ca2+ + H 2 PO 4 - + 2H2O (2) XRD AND XPS ANALYSES OF STRUCTURAL CHANGE ON HAP TREATED IN H2O2/NAF SOLUTION XRD patterns of HAP treated in the NaF solution and in the solution containing both H2O2 and NaF (H2O2/NaF solution) are shown in Figure 2. XRD patterns in Figure 2(1) reveal no substantial differences among the differently treated HAP samples. These results are in accordance with the work previously done by us (36,3 7): partly substituted fluoridated hydroxyapatite (FHAP) forms by the ion exchange between HAP and fluo ride as shown by equation 3. In contrast, the results in Figure 2(2) show that HAP was partially transformed to CaF2 , as shown by equation 4, especially in high fluoride solutions. Ca 10 (PO 4 MOH)2 + nF- ➔ Ca 10 (PO 4 )6 (OH) 2 _nF n + nOH- (3) Ca 10 (PO 4 MOH) 2 _ n F n + (20 · n)F- ➔ 10CaF 2 + 6Po/- + (2 · n)OH- (4) The fluoride ions were considered to react only with the surface atomic layers in low- 20 30 40 2 8 (deg. Cuka) 50 Figure 1. XRD patterns of HAP power: (a) untreated (6) treated in 15% H2O2 solution (c) treated in 30% H202 solution.

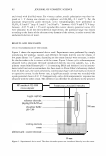
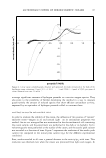
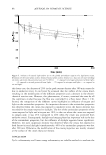
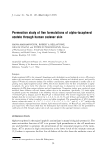
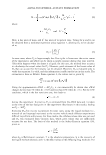
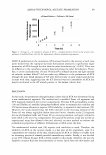
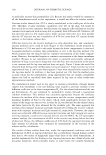
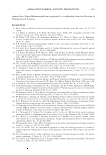
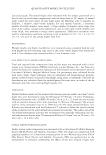
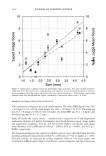
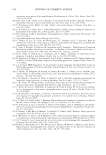
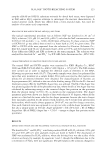
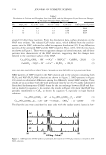
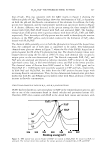
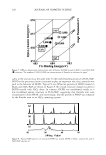
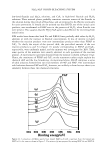
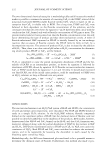
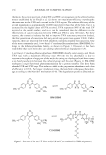
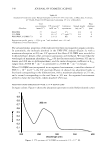
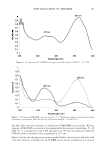
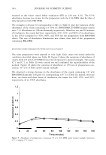
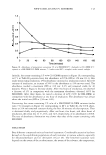
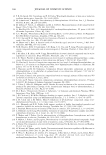
H 2 0 2 /NaF TOOTH-BLEACHING SYSTEM 30 40 (1) NaF solution 50 30 40 50 29(deg. Cukcr) (2) H202 /NaF solution 125 Figure 2. XRD patterns of HAP powder treated in NaF solution and H 2 O2/NaF solution: (a) F = 1,000 ppm (b) 5,000 ppm (c) 10,000 ppm. fluoride solutions. Hence, XPS was utilized because XRD analysis provides little infor mation about the outermost surface of the HAP. The two representative wide-scan spectra obtained from a series of HAP samples treated in NaF solution and in H 2 0 2 /NaF solution are shown in Figure 3. The comparison of the two spectra revealed no significant differences between the two HAP samples, simply showing the presence of C, 0, Ca, P, and F. Then, the peak area was calculated to estimate the relative concentrations of the detected elements. The results in Figure 4 show the effect of fluoride concentration on the changes in surface composition (Ca/P and F/Ca molar ratios) of the HAP. The use of fluoride without H 2 02 caused a small increase both in Ca/P and in F/Ca, which reached approximately 1.60 and 0.2, respectively. After that, no changes occurred to any mea surable degree in the concentration range of fluoride between 1,000-10,000 ppm, confirming FHAP formation. The use of fluoride in the presence of H 2 0 2 , however, induced a different behavior, in sharp contrast to that in the absence of H 2 02. With an increase in fluoride concentration, Ca/P and F/Ca drastically increased, suggesting that CaF 2 formed on the HAP surface besides FHAP. 1000 a(LMM) O(KLL) Ols 800 600 400 Binding energy(e V) (a) 200 0 Figure 3. XPS wide-scan spectra of HAP treated in NaF solution (a) and H2O2/NaF solution (b).
Purchased for the exclusive use of nofirst nolast (unknown)
From: SCC Media Library & Resource Center (library.scconline.org)