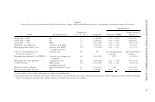
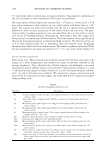
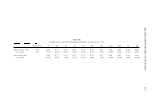
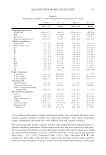
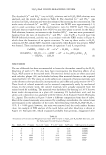
Table II Values of Conductivity and Anodic Peak Current Density, Charge, and Potential Recorded with 11 Antioxidant-Containing Creams or Free Bases Reproducibility Conductivity Current density i P Cream Antioxidant species oo-3 n-1 /cm- 1 ) Charge (mC) Potential (V /ESM) (mA/cm-2) Cream (pH = 4.86) 1 No 1.5 0.16 (4%)3 0.71 ± 0.02 0.78 (4%) Cream (pH = 6.88) 1 No 3.1 0.18 (6%) 0.59 ± 0.02 0.81 (4%) Cream (pH = 6.95 ) 1 BHT 3.3 0.21 (16%) 0.60 ± 0.02 0.95 (13%) Depilatory cream (Klorane) Thiolactic acid, BHA 3.4 3.52 (3%) 0.29 ± 0.04 6.0 (5%) Anti-aging cream (Nivea Vital) Ascorbic acid, BHT, 1.6 2.3 (16%) 0.34 ± 0.07 3.1(13%) tocopheryl acetate Corrective dermatological care Ascorbic acid 0.0 0.0 No voltammogram No voltammogram for wrinkles (Active C) recorded recorded Depigmenting emulsion (Trio D[LED}) Ascorbic acid polypeptide, 8.6 0.23 (25%) 0.702 0.6 (30%) tocopherol Whitening day cream (Decleor) Tocopheryl acetate 0.4 0.24 (16%) 0.91 ± 0.06 0.51 (13%) Ystheal emulsion BHT retinal, 0.9 0.35 (16%) 0.87 ± 0.03 0.9 (15%) tocopheryl glucoside Epithelial cream (A Derma) Retinal, tocopheryl acetate 0.1 0.133 (5%) 1.202 0.25 (4%) After-sun repair balm (Uriage) No 3.7 0.24 (9%) 0.70 ± 0.03 0.76 (12%) 1 Creams made in Pierre Fabre Laboratory (see Materials and Methods). 2 No peak potential was observed. The standard deviarion was calculated from the current at the indicated potential, where a significant anodic wave was observed. 3 Values in parentheses represent the standard deviation, evaluated with at least six samples. z """"1 """"" 0 s � ""Cl 0 � t'I1 � 0 u'Tj t'I1 � � 0 n 0 C/) � t'I1 """"1 n n � t'I1 � C/) 00 VI

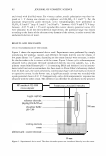
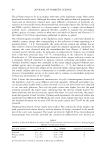
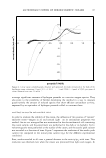
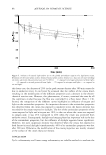
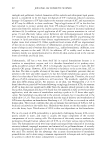
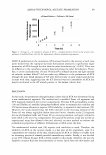
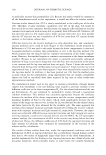
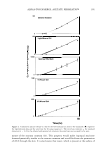
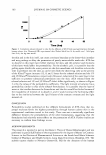
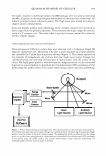
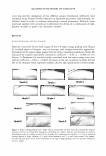
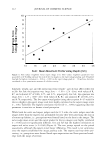
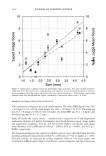
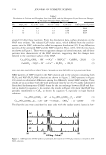
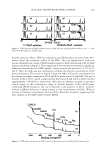
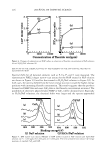
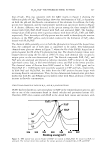
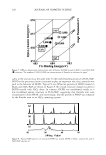
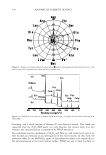
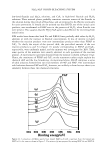
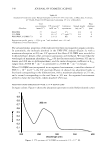
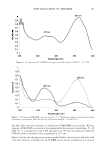
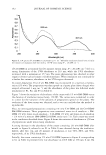
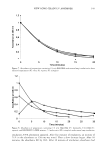
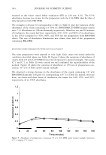
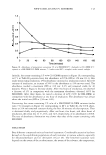
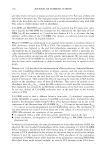
86 JOURNAL OF COSMETIC SCIENCE anodic peak current was recorded with most of the samples. The corresponding peak potential was correlated to the presence of one or several antioxidant species. Further more, the amount of charge recorded with the antioxidant-containing creams (e.g., 3.52 mC for the depilatory cream) compared to that obtained with the free bases (less than 2 · 10- 1 C) makes evidence in the first case of a global antioxidant power. Finally, the protocol gave a good reproducibility, with a standard deviation of the peak current density less than 15 % in most cases. All these results consequently attest to the reli ability of the method. The influence of the potential scan rate on the electrochemical data was also investigated. The evolution of the peak current density recorded with the depilatory cream is pro portional to the square root of the scan rate: i P = 25.ll/r 112 + 0.1644. R2 = 0.997. This linear variation suggested that the electrochemical reaction is mass transport controlled (20). Likewise, a direct proportionality was established between the peak potential and the logarithm of the scan rate: E P = 0.123/ln r + 0.71, R2 = 0.97. These results were in accordance with the Randles, Sevcik, Nicholson, and Shain equation (20) in the case of an irreversible electrochemical system and were analogous to those commonly ob served in an electrolytic solution. It might therefore be concluded that the electrochemi cal response recorded in the cream was not disturbed by subsequent ohmic drop. ADDITION OF HYDROGEN PEROXIDE AS OXIDANT Different volumes of a hydrogen peroxide (H 2 0 2 ) solution, added with a micropipette, were manually mixed with a sample of the depilatory cream until the mixture appeared homogenous. This species was added in order to simulate the action of a strong oxidant on the redox properties of the cosmetic product. Schober! and Wiesner (24) showed that hydrogen peroxide oxidized thiolactic acid with kinetics depending on the concentration of H 2 0 2 . Figure 4 shows the evolution of the cyclic voltammogram recorded in the cream as a function of the amount of hydrogen peroxide added. Cyclic voltammograrns were recorded immediately after the addition of hydrogen peroxide. When the concen tration of H 2 0 2 was less than 2 5 µrnol per gram of cream, the cyclic voltarnmogram of the cream was roughly unchanged. In this case, the whole quantity of hydrogen peroxide was consumed by antioxidants. For concentrations of H 2 0 2 ranging from 25 to 500 µmol/g, the anodic peak current at 0.31 V gradually decreased, indicating a consump tion of the antioxidants. At the same time, a second anodic peak appeared at a potential close to 0.9 V. This new current cannot be attributed to the presence of an excess of hydrogen peroxide in the cream. As a matter of fact, the peak potential did not corre spond to that classically recorded for the oxidation of H 2 02 on a platinum electrode. Figure 3 clearly shows that H202 oxidation began at around -0.4 V. Moreover, Figure 4 reveals no current corresponding to the reduction of H202 . This new anodic response can rather be attributed to the presence of one or several products resulting from the previous electrochemical and/or chemical oxidation of the antioxidant species. Finally, for concentrations of H202 more than 1000 µmol/g, the cyclic voltammogram presented the electrochemical characteristics of hydrogen peroxide, i.e., an anodic current with peak potential close to -0.25 V and a cathodic wave appearing from -0.5 V. The whole antioxidant species were then oxidized, and hydrogen peroxide was no longer consumed. It was verified that both amperometric responses increased with further successive additions of hydrogen peroxide. All these results highlight the efficiency of cream to
Purchased for the exclusive use of nofirst nolast (unknown)
From: SCC Media Library & Resource Center (library.scconline.org)